Introduction
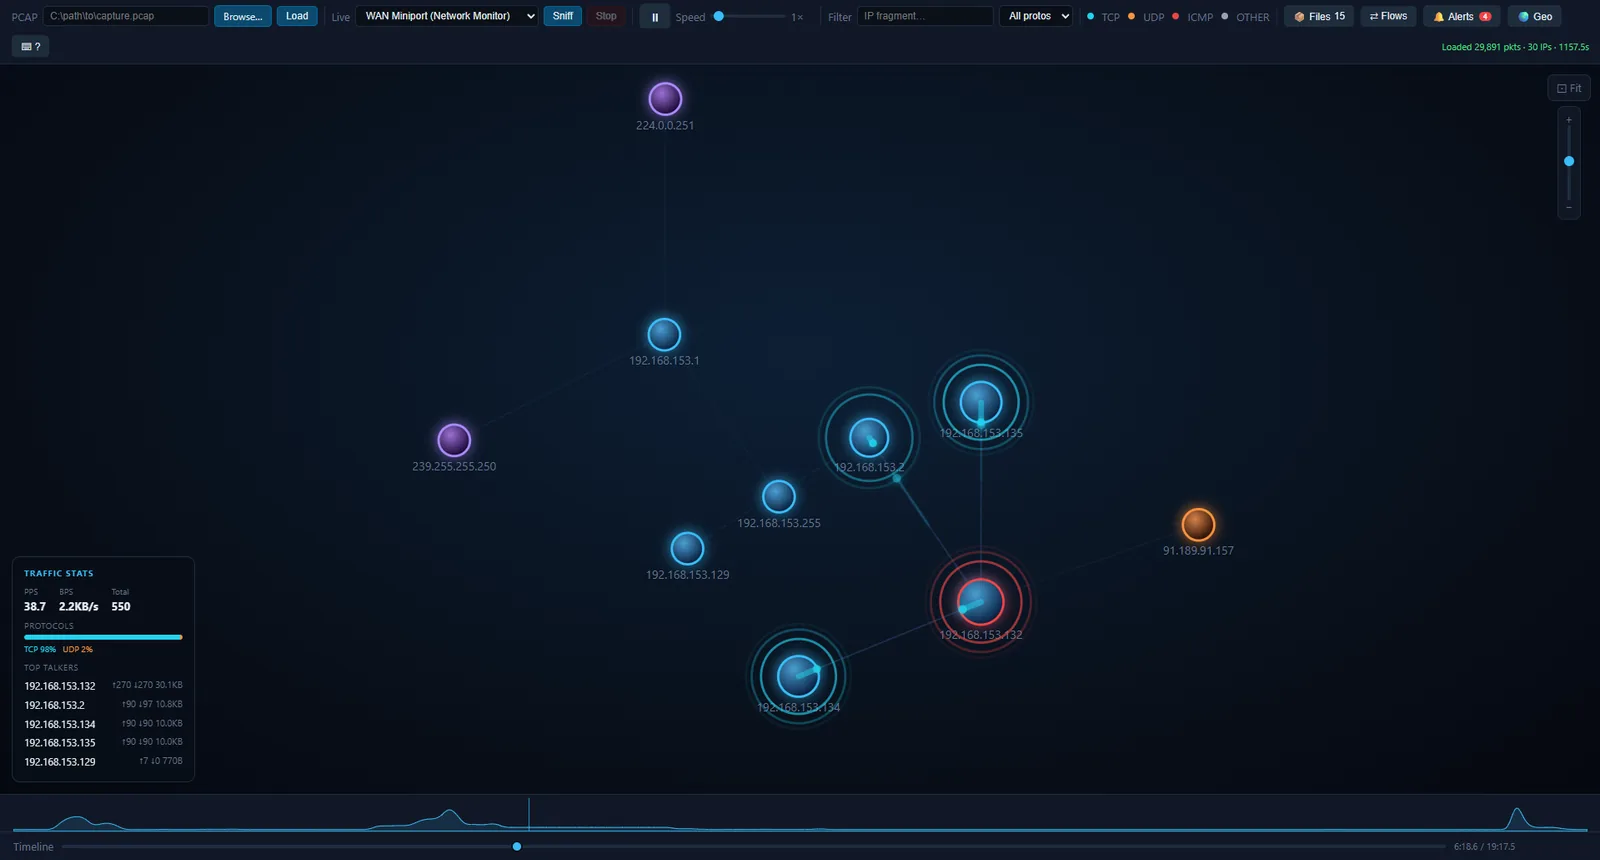
Network traffic is invisible by default — hundreds of connections happening simultaneously, anomalies buried in noise, and no intuitive way to understand what is talking to what. Pulsemap makes it visible.
Packets become animated dots traveling along the edges of a live force-directed graph. Heavy flows thicken. Anomalous nodes pulse red. You can seek through a capture like a video, drill into any TCP stream, export a filtered slice as a .pcap, and plot every external IP on a world map — all from a single browser tab with no external dependencies beyond Python.
Built on Flask + SocketIO (threading mode), Scapy, and D3.js v7. Supports both .pcap file replay and live interface capture.
Features
PCAP Replay
- Drag & drop, browse, or paste an absolute path to load any
.pcapor.pcapngfile. - Autoplay begins immediately. Pause, seek, and step one packet at a time with keyboard shortcuts.
- Sparkline above the timeline shows packets-per-second shape across the entire capture — spot bursts before you seek into them.
- Speed slider from 0.5× to 10× with real-time adjustment.
Live Capture
- Interface dropdown auto-populated on connect with friendly adapter names.
- One-click start/stop. Works with any Scapy-compatible interface.
- On Windows, requires Npcap installed in WinPcap-compatible mode.
Animated Force Graph
- Nodes represent IP addresses, sized by traffic volume.
- Edges carry animated comet-trail dots in protocol colors as packets flow.
- Edge stroke width and opacity scale with cumulative byte volume — the heaviest flows are immediately obvious.
- Force simulation with adjustable repulsion, drag, and link distance. Fit-to-screen with one key.
Flows (Connection Table)
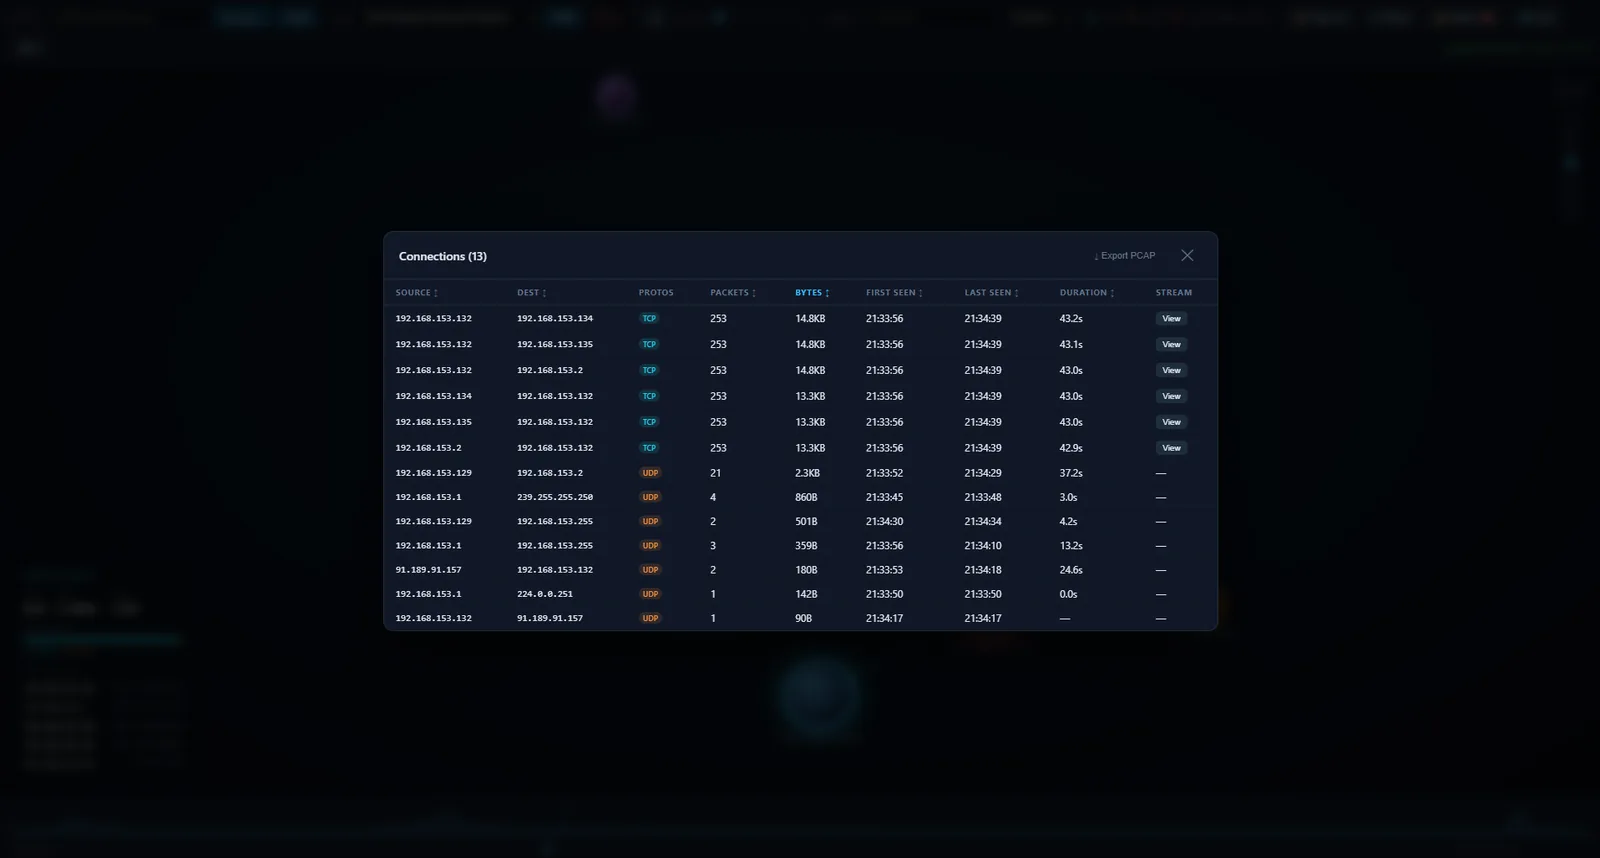
- Full sortable table of all observed flows: source, destination, protocols, packet count, bytes, first seen, last seen, duration.
- Click any row to open the inspector for that IP.
- Export PCAP — downloads a
.pcapfiltered to the current IP/protocol filter and scrubber time window.
Extracted Files
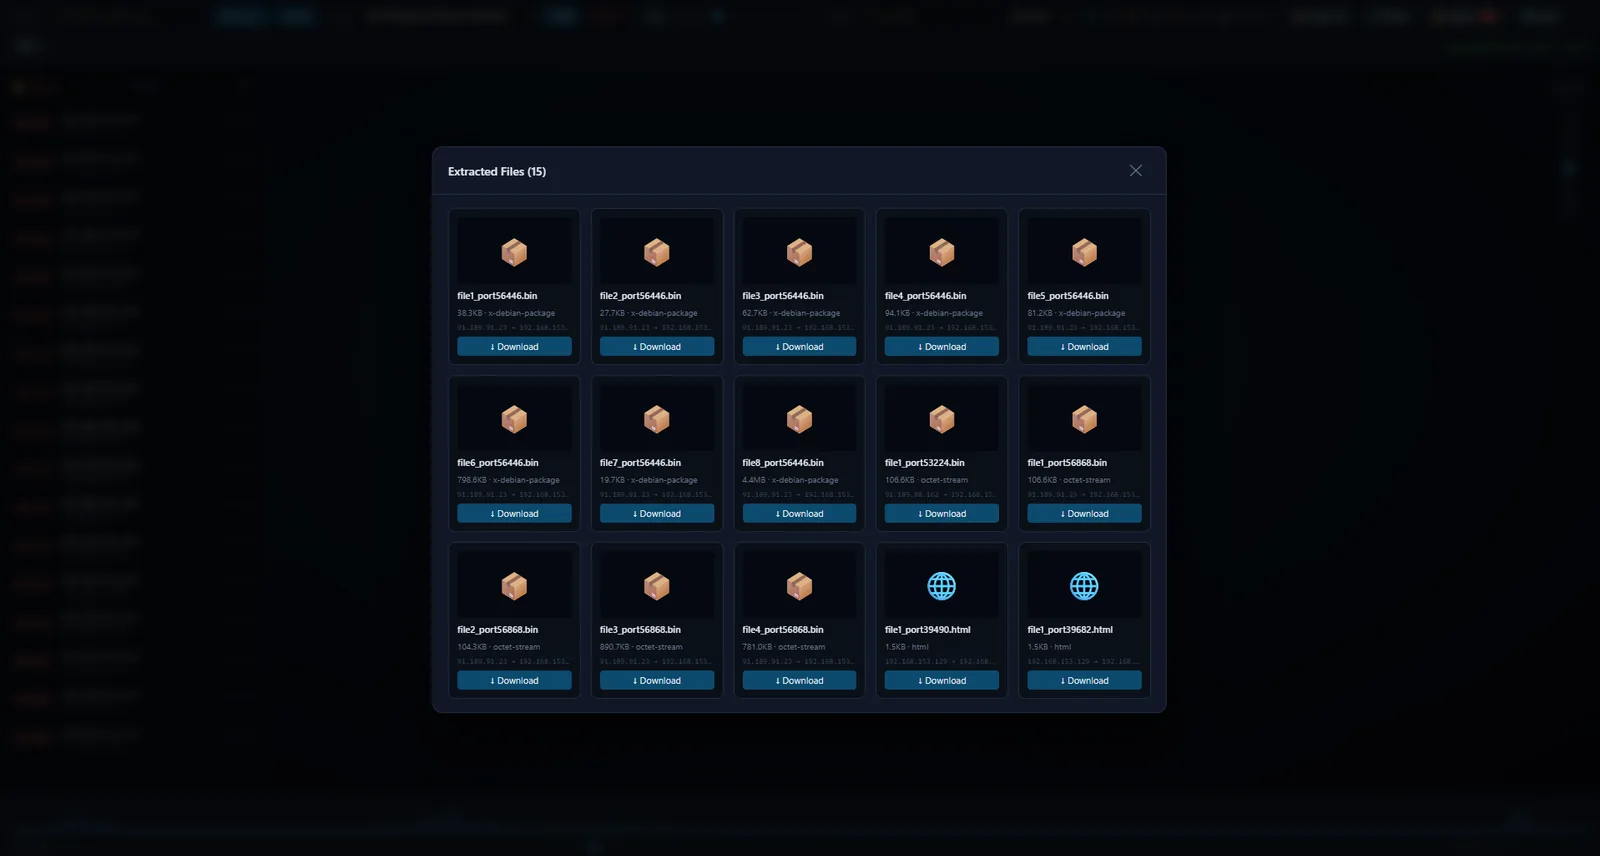
- HTTP objects (images, documents, binaries) are automatically extracted from pcap TCP streams in the background.
- The 📄 Files button appears once extraction is complete, badged with the object count.
- Click any file to download it directly from the captured data.
TCP Stream Viewer
- Click any TCP edge in the graph or a row in the Flows table to open the raw stream.
- Direction toggle: A→B / B→A / interleaved.
- Format toggle: Text (UTF-8) / Hex dump.
- Large streams load in 64 KB chunks with on-scroll fetching.
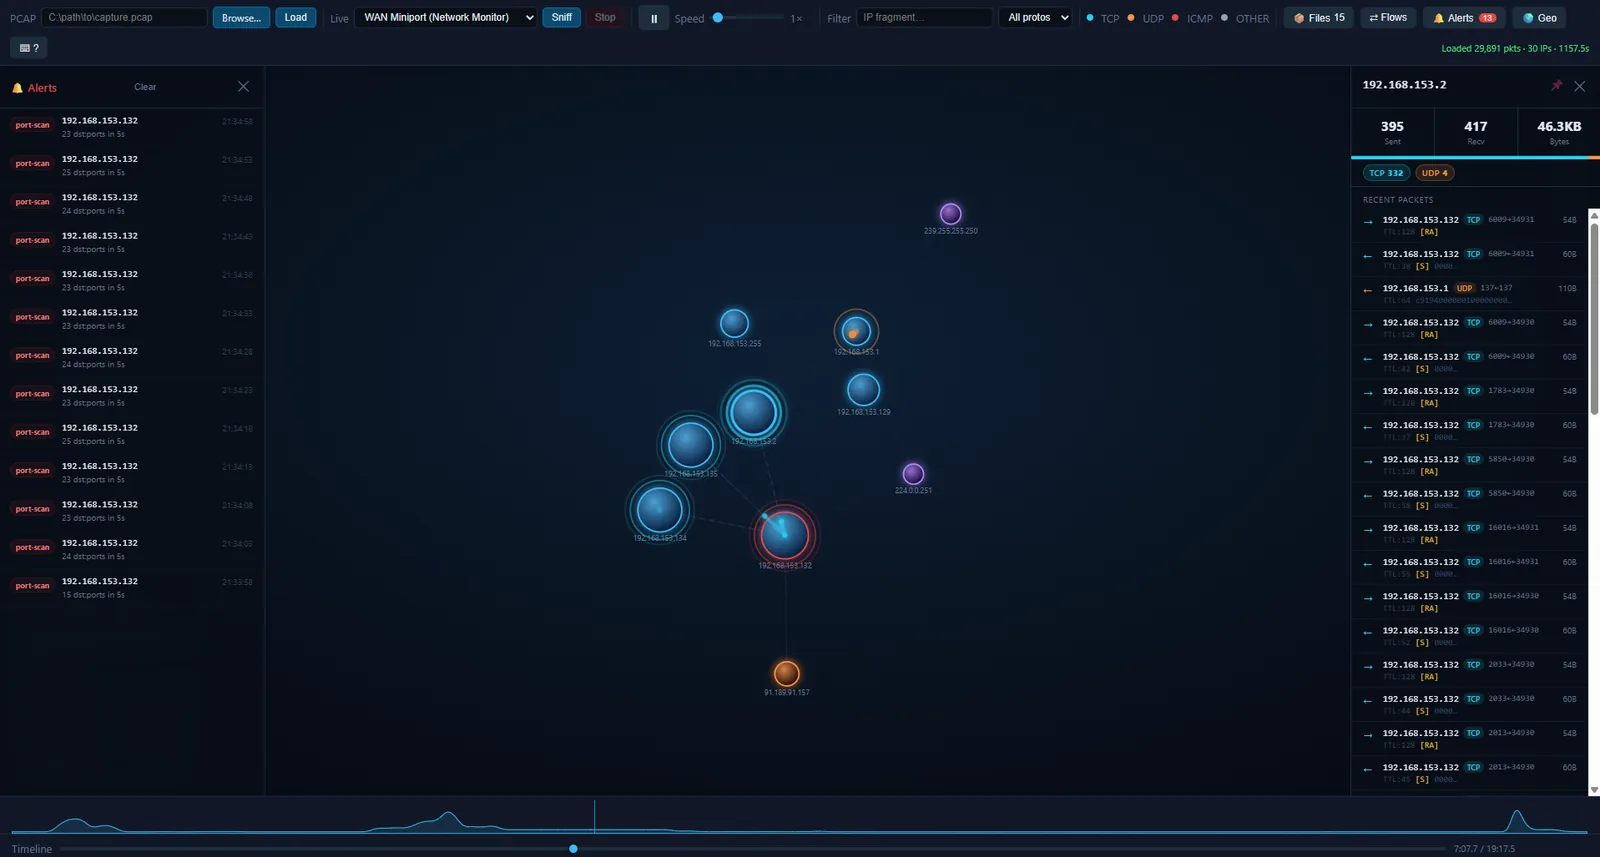
Anomaly Detection
Pulsemap continuously watches for four threat patterns in real time:
- Port scan — one source reaches ≥15 distinct dst:port pairs within 5 s
- SYN flood — ≥100 SYN-only TCP packets per second from one source
- PPS spike — a single src→dst pair exceeds 500 pps
- ICMP burst — ≥50 ICMP packets per second from one source
When a rule fires, the offending node pulses red and the event is logged in the 🔔 Alerts panel with timestamp, rule type, and IP. Click any alert to open the inspector.
GeoIP Map
- Toggle a world map panel rendered via D3 geoNaturalEarth1 + TopoJSON.
- External IPs are resolved via
geoip2fast(bundled database, no account required) and plotted as dots. - Dots fade over time. No performance cost when the panel is closed.
Inspector
- Click any node to open a side panel showing: IP, hostname (DNS), GeoIP location, packets sent/received, total bytes, protocol breakdown color bar, and peer list.
- Pin the node in place so the simulation no longer moves it. Unpin with the same button.
Filtering
- Type any IP fragment to fade non-matching nodes and animations.
- Protocol dropdown: All / TCP / UDP / ICMP / OTHER.
- Filters apply live to the graph, stats overlay, and flying dots.
How It Works
High-level runtime flow
- Browser connects via SocketIO. Server emits available interfaces and restores any in-progress state.
- PCAP path:
parser.pystreams the file with Scapy, builds packet records and PPS buckets, returns summary.extractor.pyreassembles TCP streams and extracts HTTP objects in a background thread. DNS and GeoIP workers resolve IPs asynchronously. - Live capture: Scapy
sniff()runs in a daemon thread. Each packet is processed by the samepacket_to_recordpipeline and emitted immediately. - The replay loop wakes at sub-millisecond precision, emits
packetevents in real-time-speed order, and handles pause/seek/speed-change via a shared state dict protected by athreading.Lock. - The D3 frontend receives
packetevents, upserts nodes and links, fires comet-trail animations, runs anomaly detection, and updates the stats overlay — all at wire speed.
Sequence diagram — PCAP replay
Sequence diagram — Live capture
Flow diagram — data pipeline
Code Architecture
Components & responsibilities
| File | Responsibility |
|---|---|
main.py |
Flask + SocketIO server. Replay loop, DNS worker, GeoIP worker, live sniff thread. Routes for pcap upload, export, and TCP stream slices. Startup banner, argparse, auto-browser launch. |
parser.py |
Scapy pcap streaming parser. packet_to_record extracts IP/TCP/UDP/ICMP fields. summarize computes per-node stats and 200-bucket PPS array for the sparkline. |
extractor.py |
TCP stream reassembly (reassemble_tcp_streams) and HTTP object extraction (extract_http_objects). Streams both A→B and B→A directions. |
geoip.py |
geoip2fast wrapper. lookup(ip) returns {country, country_code, city, lat, lon} or None for private/loopback IPs. |
templates/index.html |
Single-file D3 v7 frontend. Force simulation, comet animations, anomaly detection, stats overlay, inspector, connection table, TCP stream viewer, GeoIP map panel, sparkline, keyboard shortcuts. |
Key data structures
Packet record (parser.py)
{
    "src":   "192.168.1.10",
    "dst":   "93.184.216.34",
    "proto": "TCP",           # TCP | UDP | ICMP | OTHER
    "size":  1460,            # bytes
    "ts":    1700000000.123,  # epoch float
    "sport": 54321,
    "dport": 443,
    "flags": "S",             # TCP flags string, or ""
}
Link record (frontend links Map)
{
  source:    "192.168.1.10",
  target:    "93.184.216.34",
  count:     842,
  bytes:     1243008,
  firstSeen: 1700000000123,   // ms
  lastActive: 1700000060000,  // ms
  protos:    { TCP: 1200000, UDP: 43008, ICMP: 0, OTHER: 0 }
}
Talker record (frontend talkers Map)
{
  sent:   412,
  recv:   430,
  bytes:  1243008,
  protos: { TCP: 1200000, UDP: 43008, ICMP: 0, OTHER: 0 }
}
Alert entry (frontend alerts array)
{
  ts:     1700000045000,   // ms
  type:   "port_scan",     // port_scan | syn_flood | pps_spike | icmp_burst
  ip:     "10.0.0.5",
  detail: "42 dst:port pairs in 5s"
}
Socket events reference
Server → Browser
| Event | Payload | Description |
|---|---|---|
packet |
{src, dst, proto, size, ts, sport, dport, flags} |
Single packet during replay or live capture |
pcap_loaded |
{packets, node_count, duration, t0, t_end, pps_buckets} |
PCAP parse complete |
streams_ready |
{count, streams[{id, src, sport, dst, dport, bytes}]} |
TCP stream reassembly complete |
files_ready |
{count, files[{filename, size, src, dst}]} |
HTTP object extraction complete |
dns |
{ip, hostname} |
Reverse DNS result |
geo |
{ip, country, country_code, city, lat, lon} |
GeoIP result |
progress |
{ts} |
Current replay timestamp (throttled) |
seeked |
{ts} |
Scrubber position after seek or step |
state_changed |
{playing?, speed?} |
Play/pause or speed changed |
playback_ended |
— | Replay reached end of capture |
live_started |
{iface} |
Live capture running |
live_stopped |
— | Live capture stopped |
interfaces |
[{id, label}] |
Available network interfaces |
error |
{message} |
Error (e.g. Npcap not installed) |
Browser → Server
| Event | Payload | Description |
|---|---|---|
load_pcap |
{path} |
Load a pcap by filesystem path |
play / pause |
— | Start or pause replay |
set_speed |
{speed} |
Set replay speed (0.5–10) |
seek |
{ts} |
Seek to timestamp |
step |
{delta} |
Step ±N packets |
start_live |
{iface} |
Begin live capture |
stop_live |
— | Stop live capture |
Anomaly detection
All detection runs client-side inside trackPacket() using rolling time windows — no server round-trip required.
| Rule | Condition | Window |
|---|---|---|
| Port scan | 1 src → ≥15 distinct dst:port pairs | 5 s |
| SYN flood | 1 src → ≥100 TCP SYN (no ACK) packets | 1 s |
| PPS spike | 1 src→dst pair → ≥500 packets | 1 s |
| ICMP burst | 1 src → ≥50 ICMP packets | 1 s |
Each rule throttles per-(rule, ip) for 5 s to prevent alert storms. Cap of 200 alerts retained in memory.
Protocol colors
| Color | Protocol |
|---|---|
Cyan #22d3ee |
TCP |
Orange #fb923c |
UDP |
Red #ef4444 |
ICMP |
Gray #94a3b8 |
OTHER |
Installation & Usage
Install
git clone https://github.com/GamehunterKaan/pulsemap.git
cd pulsemap
pip install -r requirements.txt
Run
python main.py              # default port 5000
python main.py --port 8080  # custom port
The browser opens automatically. If it doesn’t, navigate to http://127.0.0.1:5000.
Windows notes
- Live capture requires Npcap. During install, check “Install Npcap in WinPcap API-compatible Mode”.
- Run the terminal as Administrator if you get permission errors on live capture.
Keyboard shortcuts
| Key | Action |
|---|---|
Space |
Play / Pause |
← → |
Step one packet |
+ − |
Speed up / down |
F |
Fit graph to screen |
Esc |
Close inspector, clear filter |
/ |
Focus IP filter input |
? |
Show shortcut help overlay |
Sample pcap files
Wireshark sample captures are a good source of test data covering HTTP, DNS, ICMP, and various anomaly patterns.