Introduction
TEFAS publishes the data on every Turkish investment fund. It just makes it very hard to compare. The question a saver actually has — “which funds are worth buying, and what am I really exposed to?” — needs composition, cost, risk and a benchmark side by side, and the official site puts none of them there.
FundHunter is a static, serverless site over the entire buyable TEFAS universe: 2,063 funds, mutual (YAT) and exchange-traded (BYF), plus all 648 Borsa İstanbul listings alongside them. Every fund’s portfolio composition, price history, returns and risk; every company’s statements and who owns it. Everything filtered and searched in the browser.
Data refreshes daily via GitHub Actions and is committed as JSON. There is no backend and no build step. The only runtime dependency is the live-quote feed behind the market tape, and the page falls back to committed closes without it.
The design follows from the data: every fund is a set of weights summing to 100, so the composition bar is the recurring unit of the interface — one for the whole industry, one per row in the table, one full breakdown per fund.
The universe
The list is what a saver can actually buy, and that boundary is drawn deliberately:
- Pension (EMK) funds are excluded — you cannot buy one directly. A BES contract with its provider is the only route
- GYF/GSYF are excluded — they are closed-end
pruneHistorydeletes the history of anything that leaves the universe, so a delisting never leaves a stale file behind
Features
The dashboard
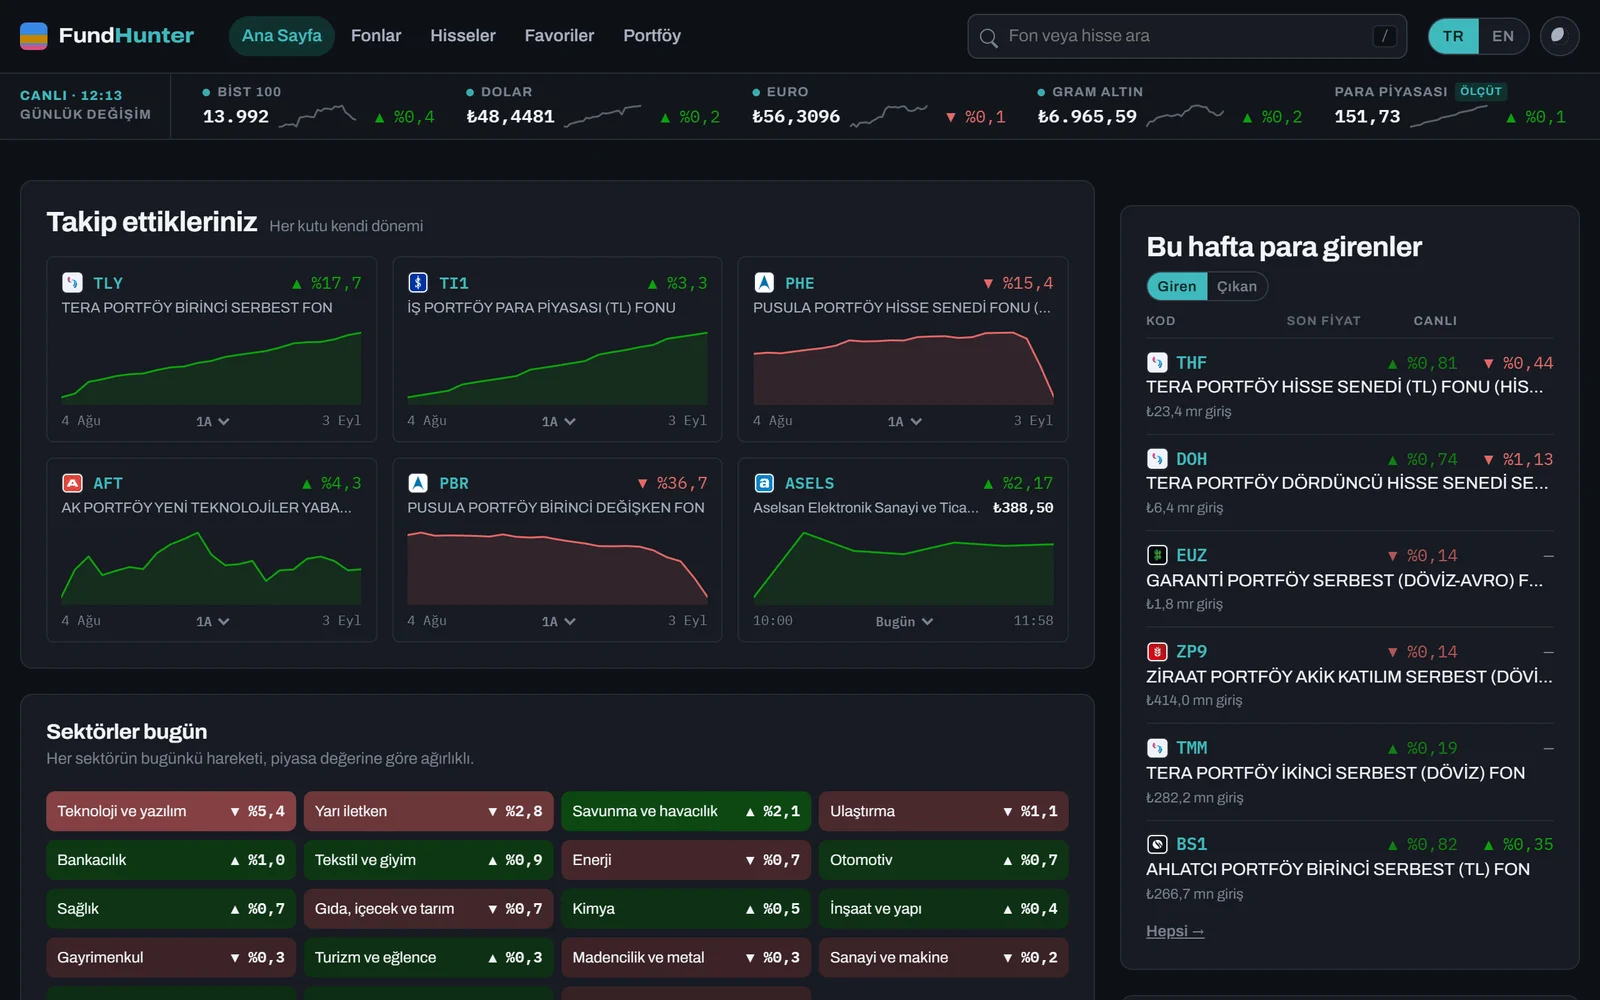
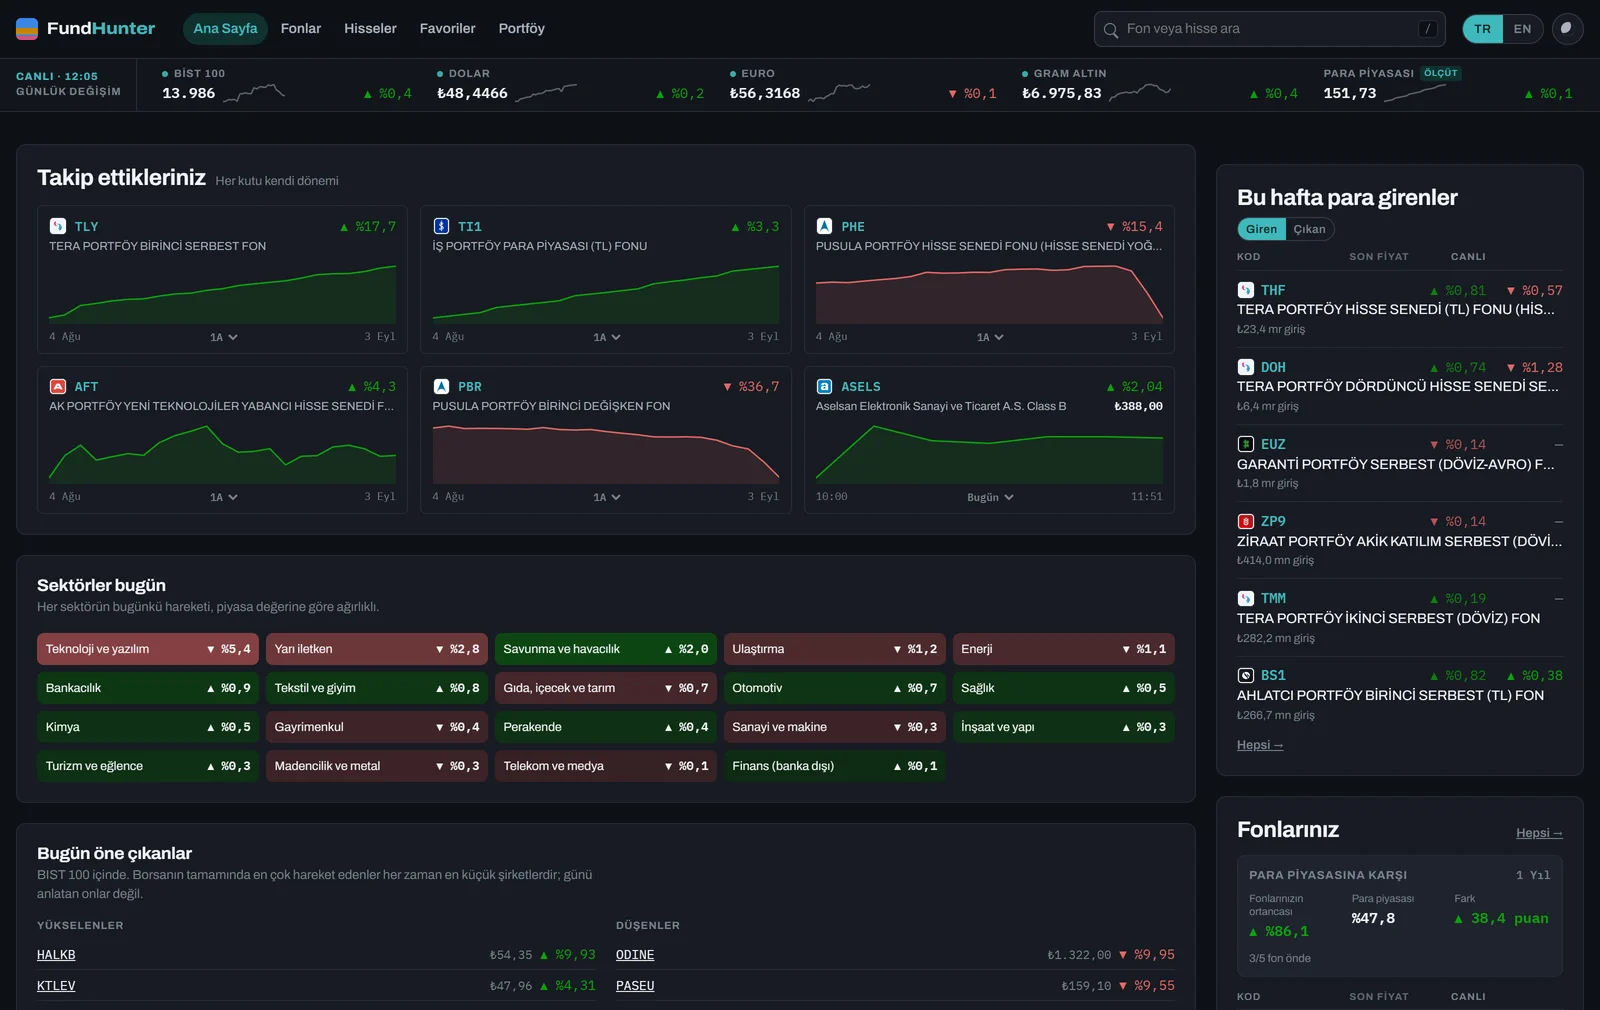
#/ is not the fund list. The list is where you go to look for a fund; the dashboard is where you go to see what the ones you already care about are doing.
| Pane | The question it answers |
|---|---|
| Money in this week | the seven-day net flow ranking, in either direction |
| What you follow | a month of each starred fund, one chart per fund |
| Your funds | the same funds as rows, over the money-market hurdle |
| Portfolio overlap | whether two funds you hold are the same fund |
| Themes today | what each line of business did, weighted by market value |
| Movers today | the best and worst of the BIST 100 |
| Trending | the sectors and shares that have been going up over the past week |
Every row carries two figures side by side on purpose. Last price is the most recent change TEFAS published — it runs one business day behind the market it reflects. Live is what the fund’s actual holdings have done since, from share prices delayed 15 minutes. The second is an estimate of the move the first has not caught up with yet, and that gap is the whole reason the dashboard exists.
One market scan covers the whole page: Borsa İstanbul comes back whole in a single request, so the cost of another row is one holdings file, not another round trip to the exchange.
The fund list
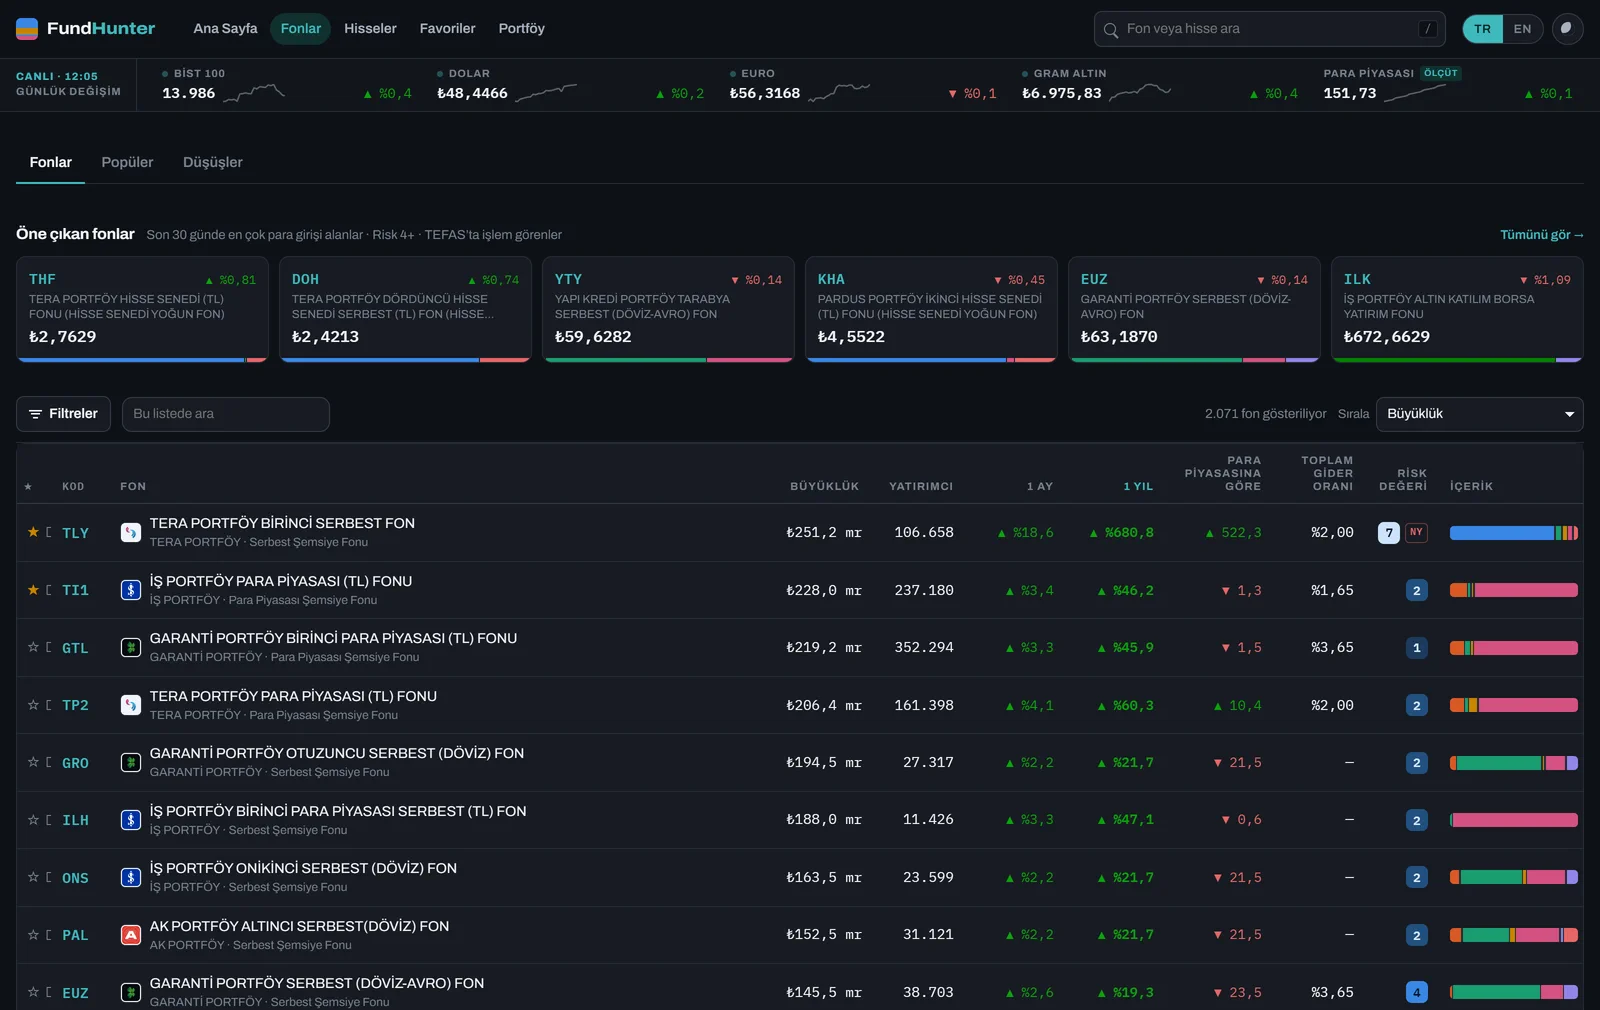
Masthead → market tape → a short rail of funds taking in money → toolbar → table. BIST 100, the dollar, the euro and gram gold are live, polled every 60 seconds. The money-market index on the tape is deliberately not live and cannot be — it is derived from TEFAS fund NAVs, which are daily and a day behind. It rides the tape anyway, marked ölçüt: it is not a market, it is the thing that beat four fifths of the funds in the table.
Filters live behind a button, but their state does not — every active filter is a named, removable chip with a count on the button, so a narrowed list can never be mistaken for the full universe.
The fund page
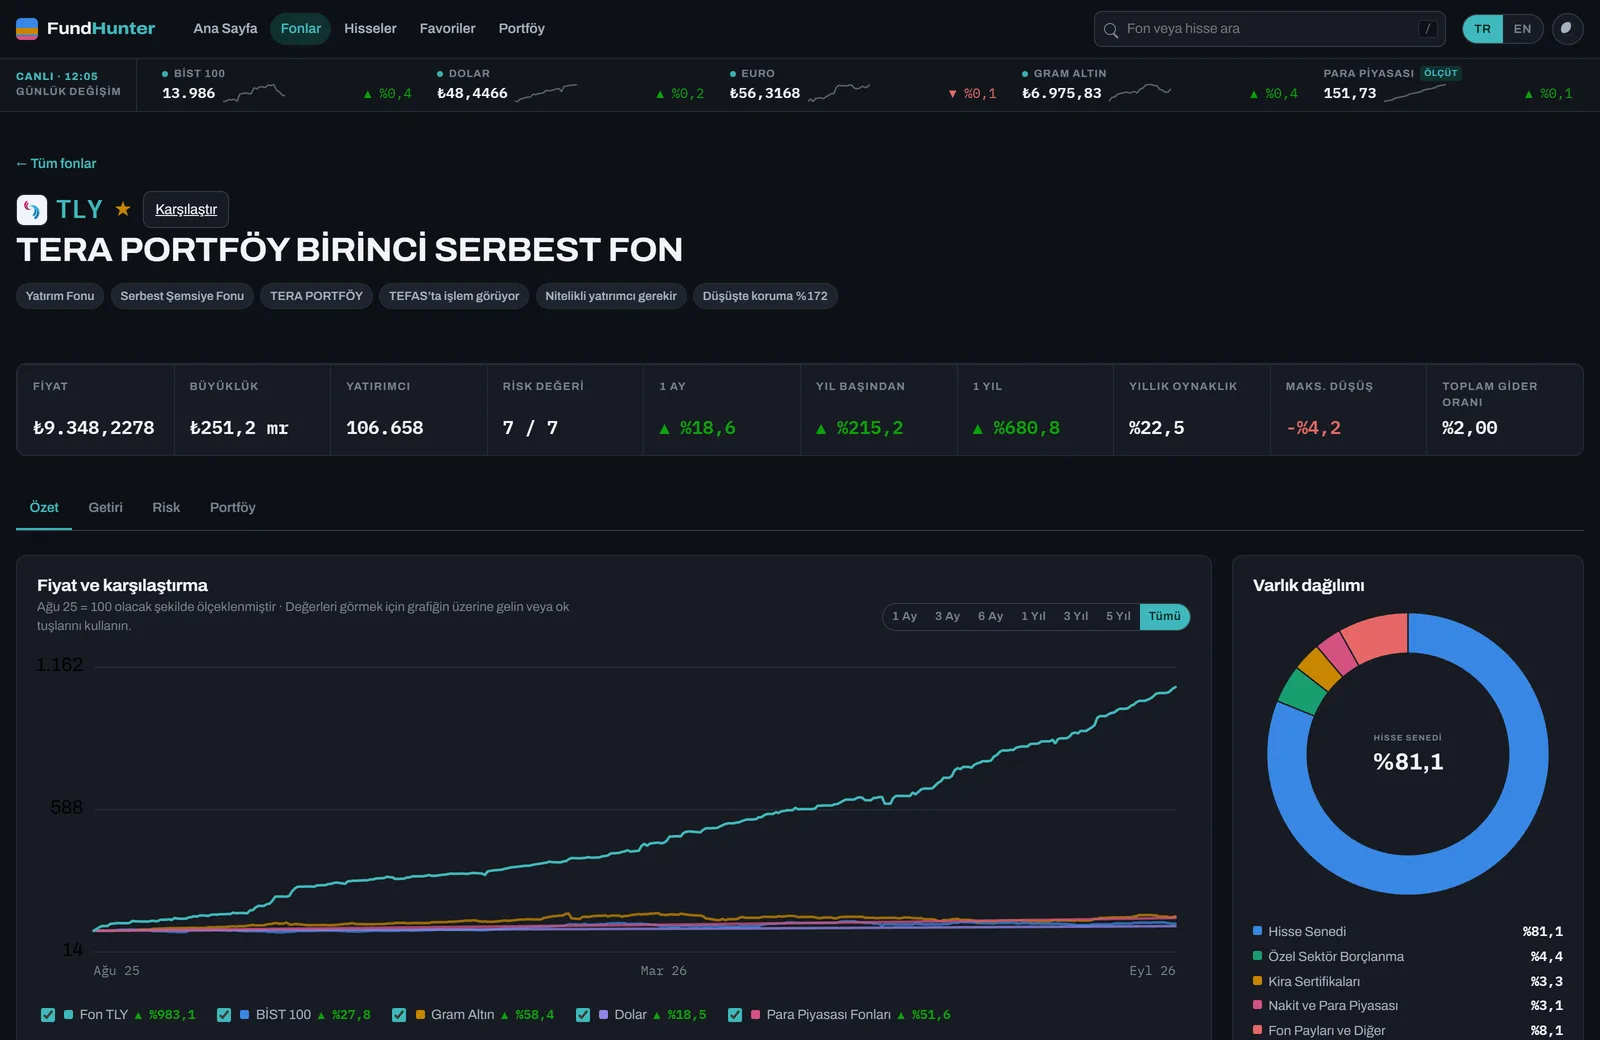
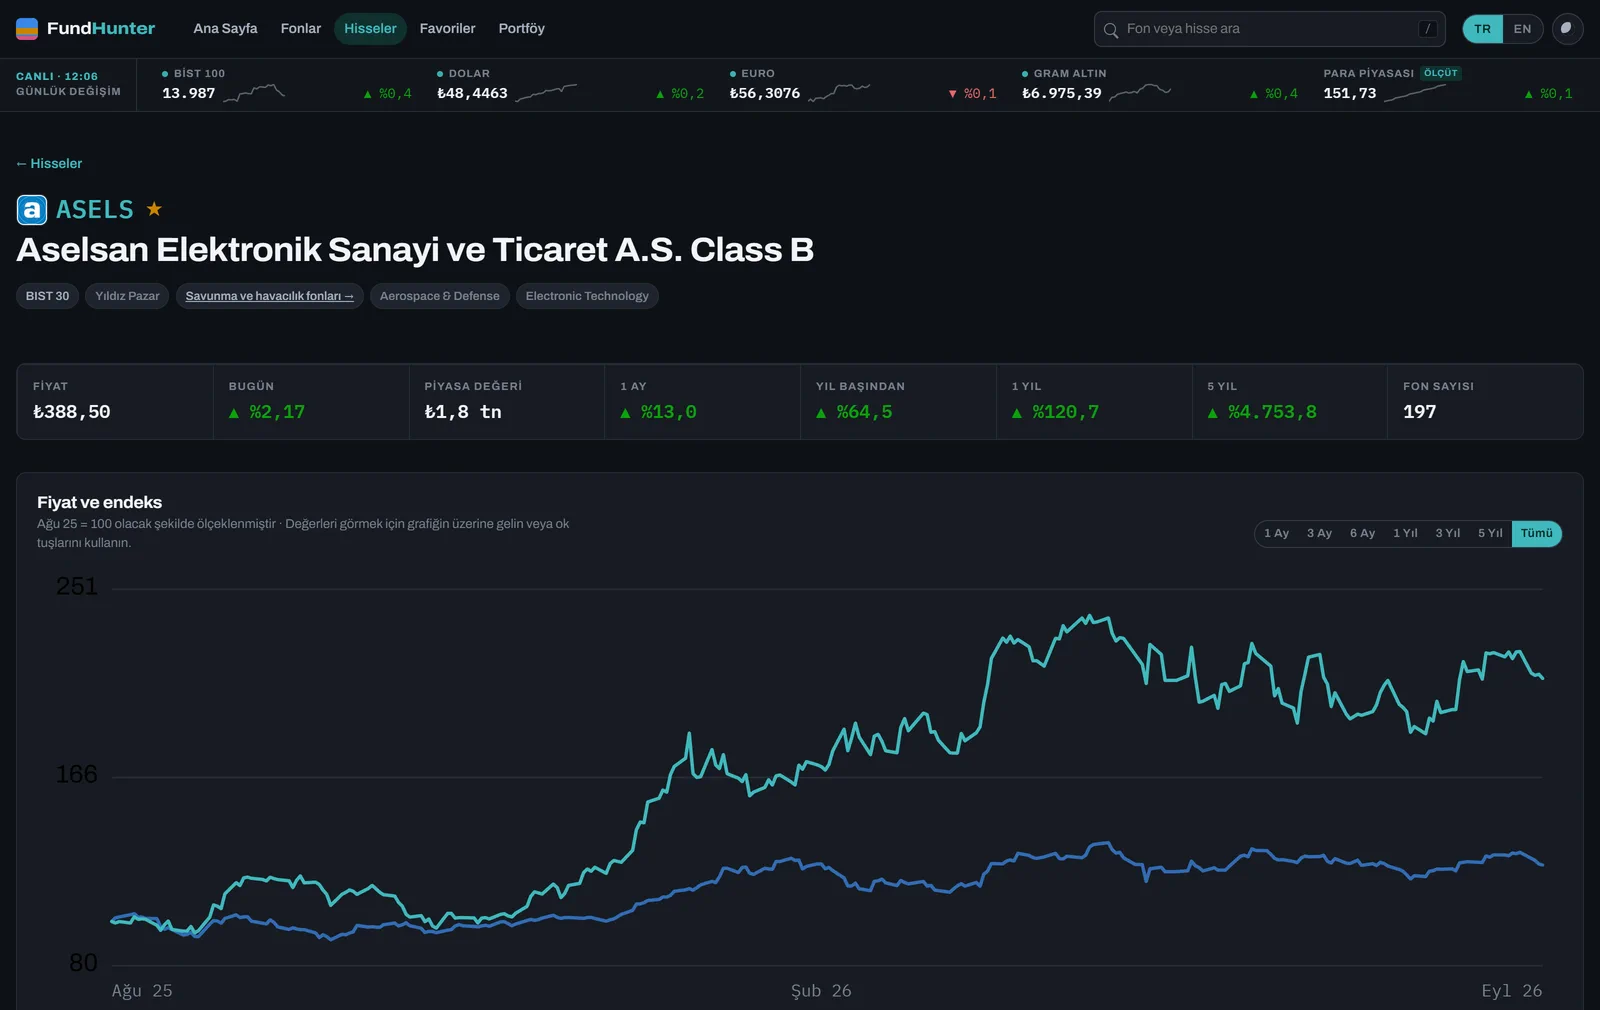
Price against five benchmarks indexed to 100, the asset-class donut, and then — behind tabs — returns, risk, and the full portfolio.
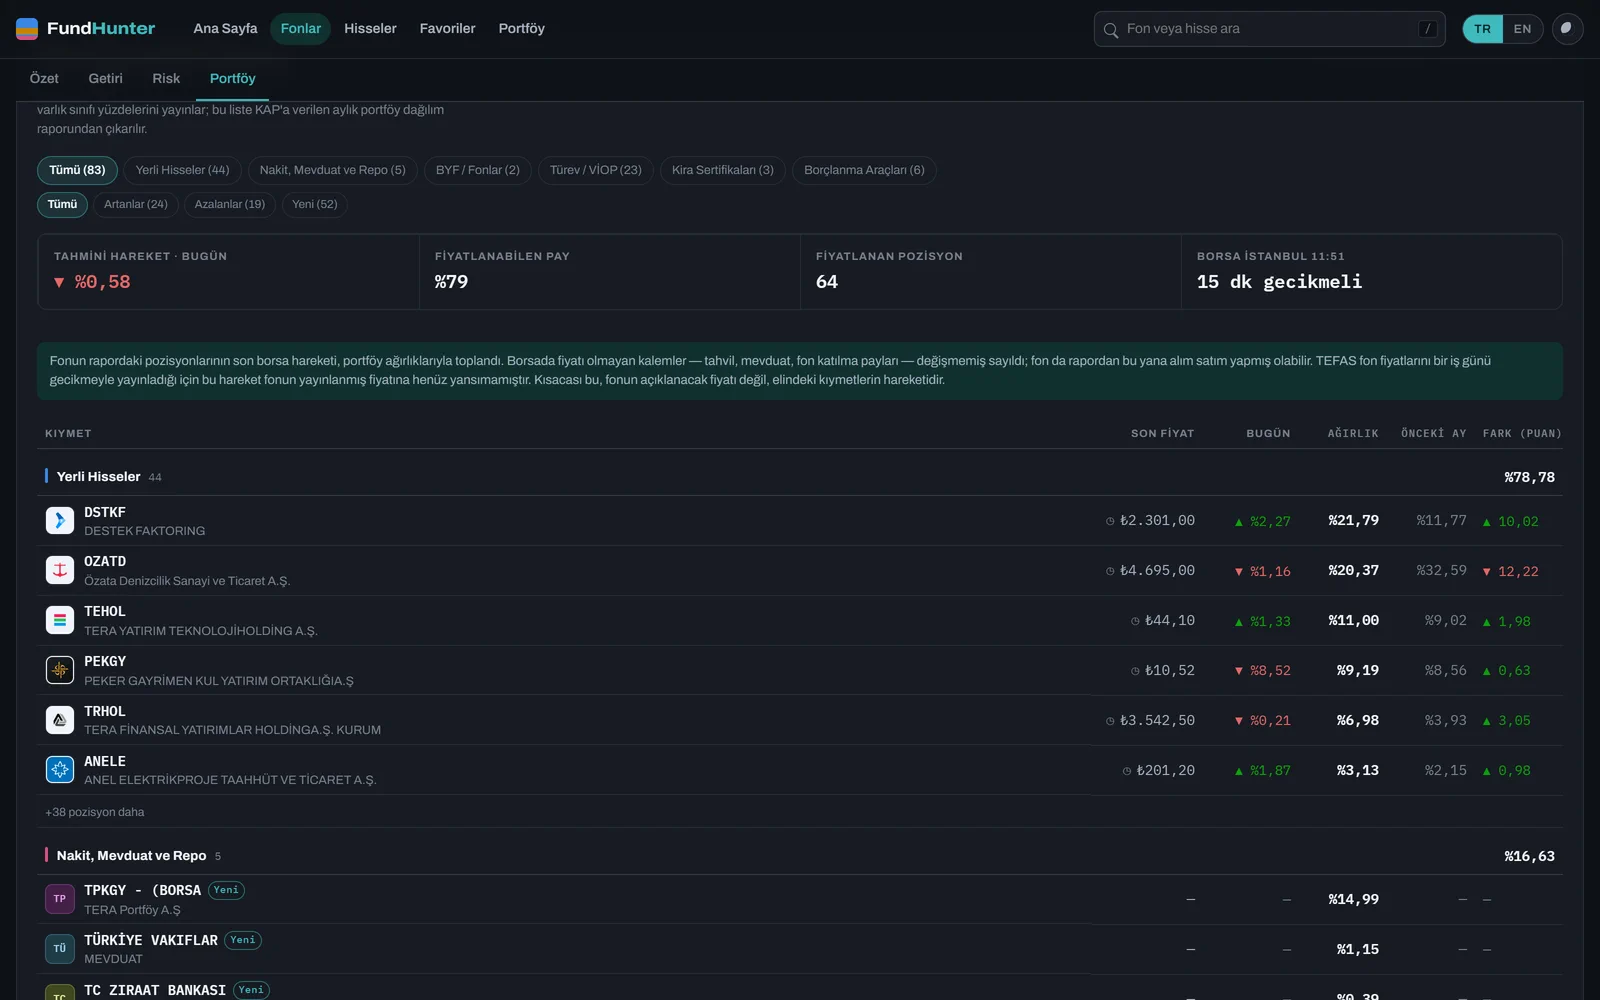
The holdings table is the part TEFAS cannot give you. TEFAS says a fund is 37% precious metals; it never says which metals, or which shares make up the equity sleeve. That comes from the Portföy Dağılım Raporu every fund files monthly with KAP — and it is the only public route to a fund’s actual positions. Each row carries the last exchange price, today’s move, the current weight, what it weighed the month before, and the difference in points.
Crash protection
Every return on this site is measured over a window the market spent mostly rising. That flatters everyone. This measures the other thing: what happened to your money the last ten times BIST fell.
crashEpisodes() cuts the BIST 100 series into declines of 10% or more, from a local high to the low that follows it, over the last three years — ten of them, from a 4-day 16.7% drop in March 2025 to a 42-day 12.0% slide in early 2026.
This is deliberately not the textbook drawdown, which runs from a peak until that peak is regained. That definition merges separate crashes into one long underwater stretch: BIST’s July 2024 high was not reclaimed until August 2025, which swallows the March 2025 crash — the deepest of the three years — whole. Here a fall ends when the index rebounds 5% off its low.
spared is the share of the fall the fund’s holders were spared, and the whole scale is readable:
| Score | Meaning |
|---|---|
| 100 | came through no worse off than money sitting in a money-market fund |
| 0 | took the index’s hit in full |
| > 100 | made money the market did not |
| < 0 | fell further than the index |
Six BIST 30 index trackers land at 1, 2, 2, 3, 4 and 5 — which is the calibration check, since tracking the index is exactly what avoiding none of its fall looks like.
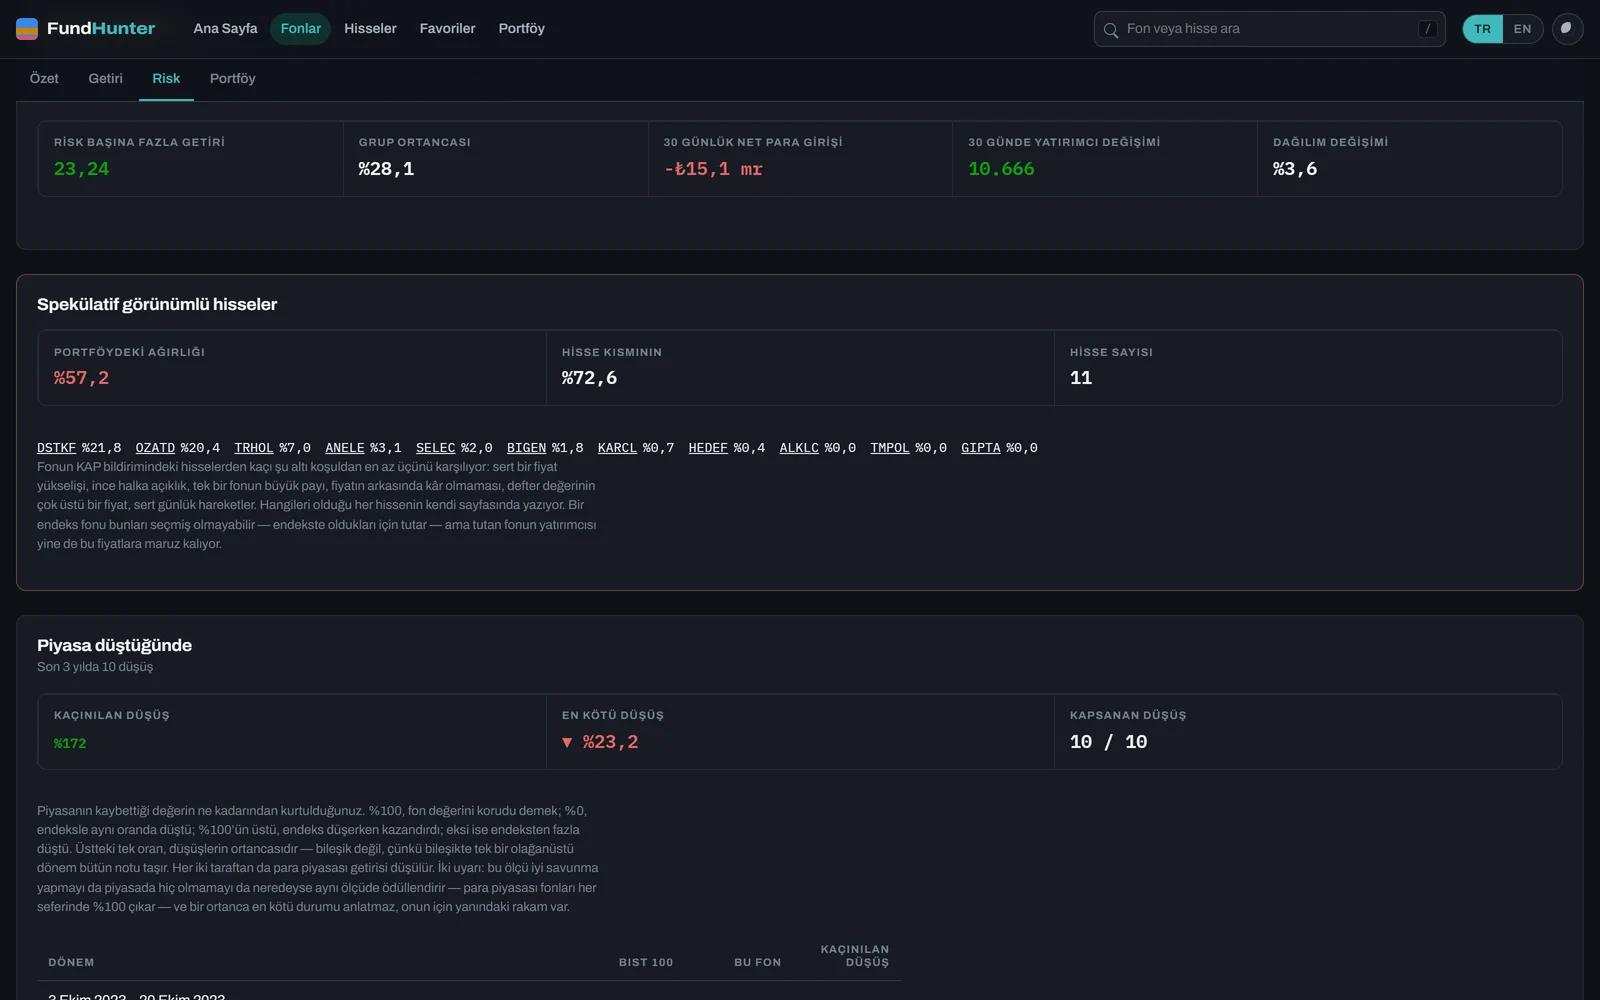
2,008 of 2,063 funds are measured — 99.7% of the industry’s money — and 1,116 lived through all ten falls. A fund needs two falls to get a figure; one is an anecdote.
Speculative boards
Tahta is Turkish market slang for a share whose price board a small group can move at will. Nothing in any dataset can prove that anyone did, and this does not try to. What it measures is not conduct but condition, from six figures the exchange itself publishes:
| Condition | Threshold |
|---|---|
| Sharp run-up | +75% over a quarter, or +200% over a year |
| Thin free float | a quarter or less of the shares actually trade |
| One fund holds a large stake | a single fund holds ≥5% of the whole company |
| No earnings behind the price | the company loses money, or P/E ≥ 100 |
| Far above book value | P/B ≥ 10 |
| Violent daily moves | monthly volatility ≥ 8%, twice the exchange’s median |
The run-up is required. A thin, loss-making, closely-held company whose price has not moved is an illiquid company, not a board being worked — and saying otherwise about a real business would be both wrong and unfair. Three conditions including that one is the bar; 25 of 624 companies clear it.
A share page can show the conditions. Only this project can tell you that two thirds of a fund you might buy is in shares like that, because that needs every filing at once.
Shares and the market map
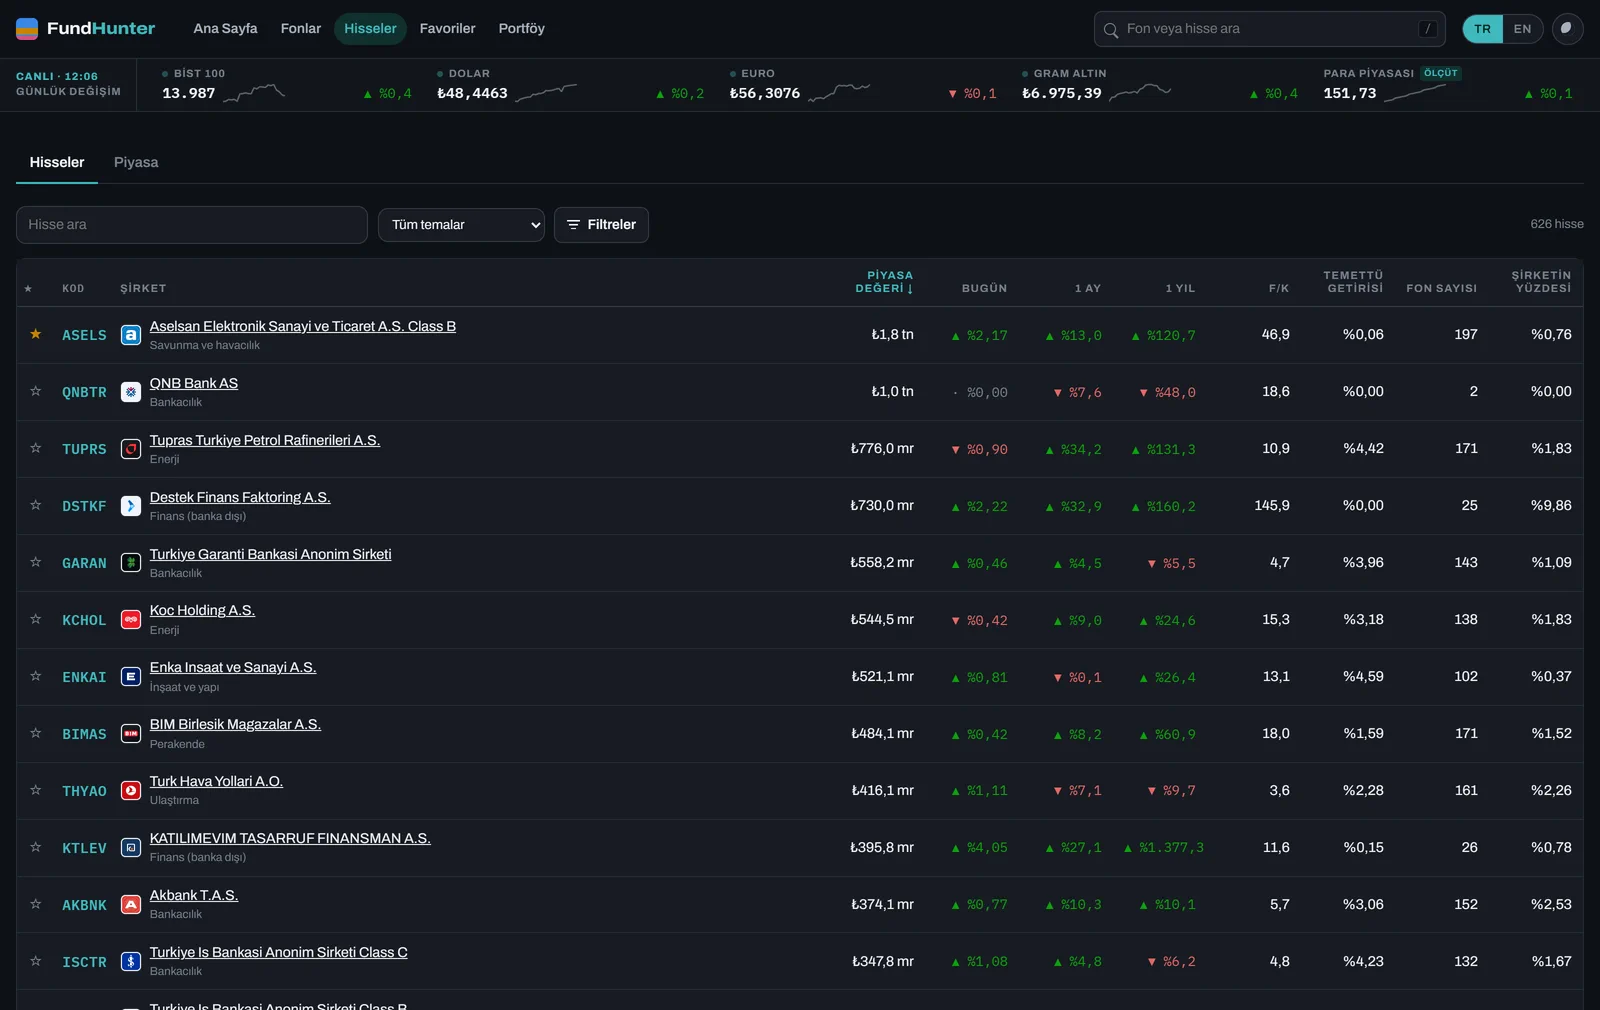
#/hisseler is Borsa İstanbul read the other way through the same filings — 624 companies with valuation, the business, the balance sheet, trading, analysts and financial strength, plus which funds hold each one. The statements come before the multiples on purpose: every ratio in the grid below them is a ratio to those numbers.
The market map is the hundred largest companies, area by market value, colour by today’s move, grouped by line of business — a squarified treemap, two levels deep. One level would say which companies moved; two says which industries did, which is the only thing a market map is really for.
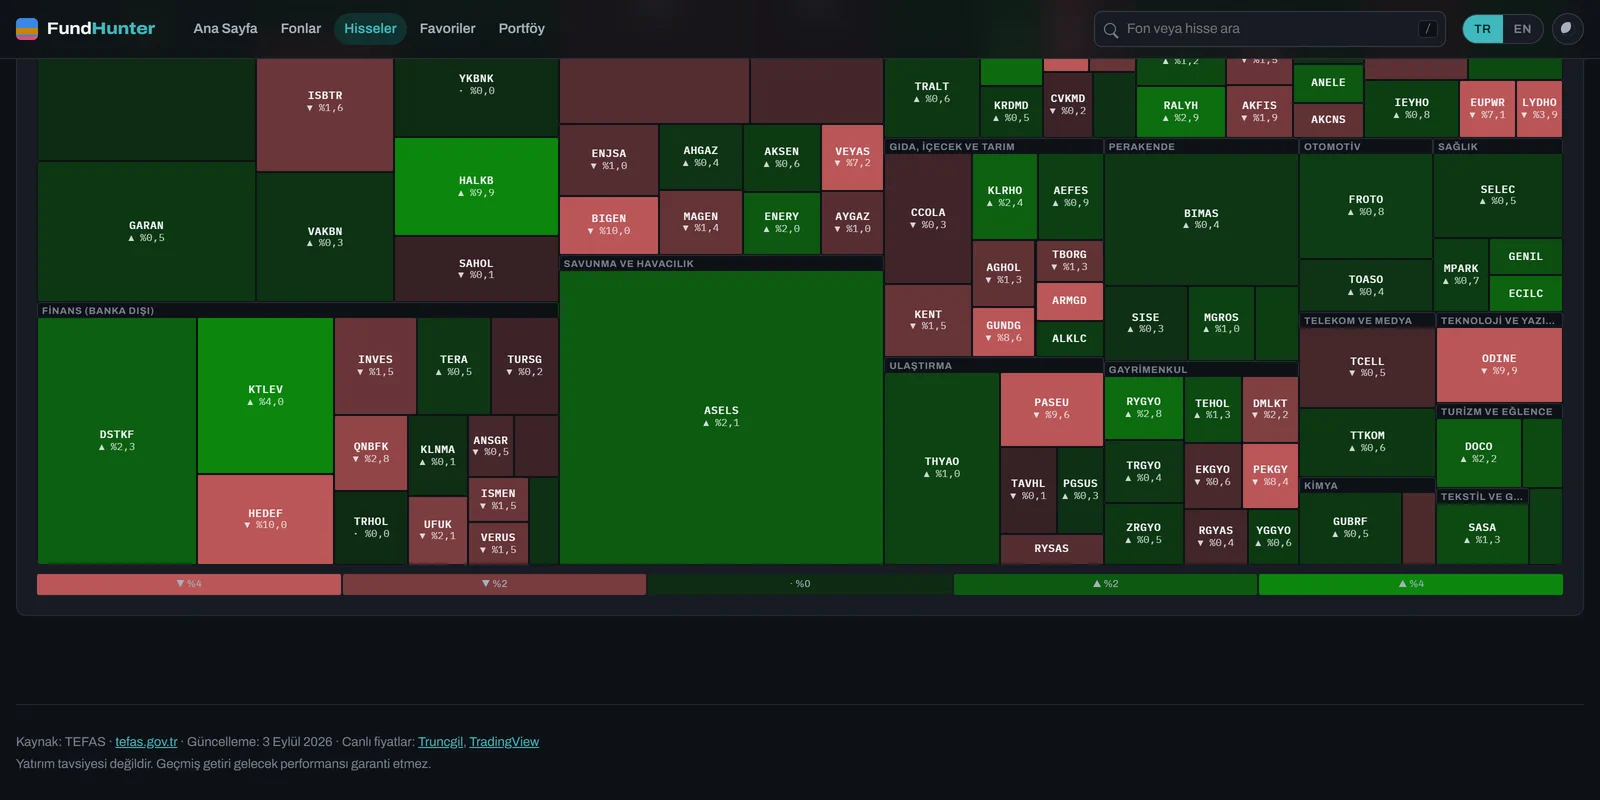
The layout is Bruls, Huizing and van Wijk’s algorithm, implemented as squarify() in core.js with tests — a treemap that silently overlaps or overflows its box is exactly the kind of bug an eye skips over. Tiles smaller than 46×26px lose their label, because a clipped ticker is worse than none.
The portfolio
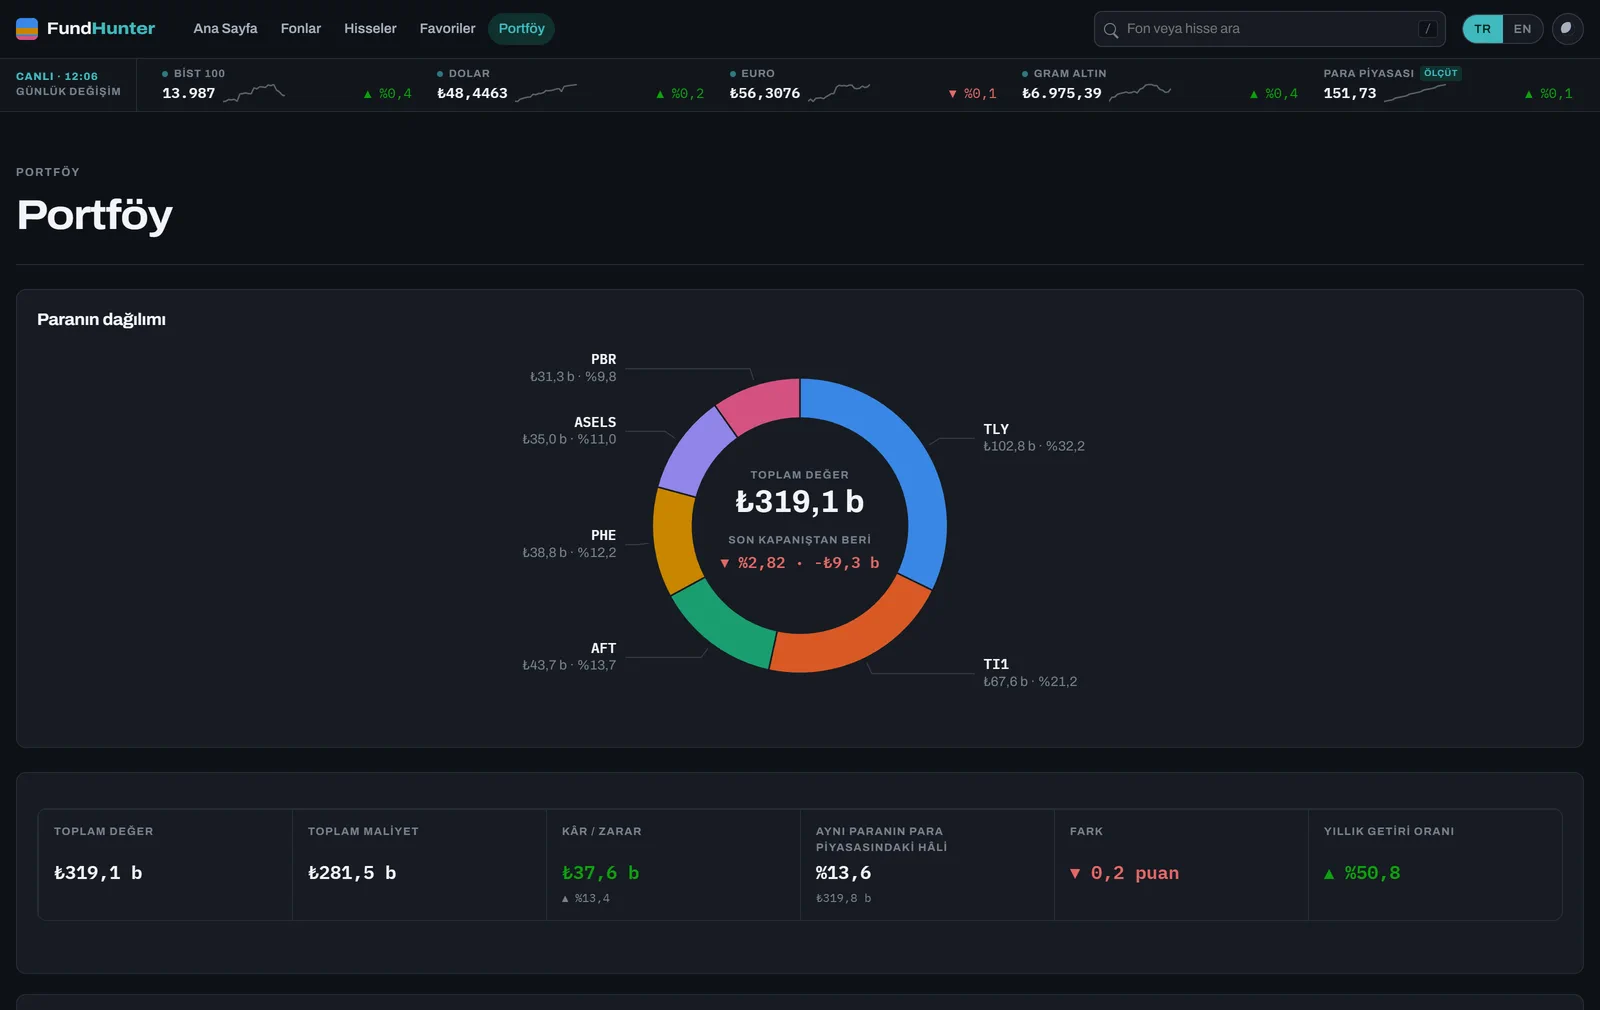
Every other page answers “what does this fund hold”. This one answers “what do I hold”, which is not the same question and is the one nobody else can answer: it needs the KAP filings and your own position sizes at the same time.
A position is a list of lots, not a number. You buy the same fund twice at two prices, and one units field can only answer that by throwing away what each of them cost. Everything on screen is derived from the lots every time rather than stored beside them, so the two can never disagree.
Four funds bought for four different reasons are routinely the same six companies. Opened up, one row per company, they say so.
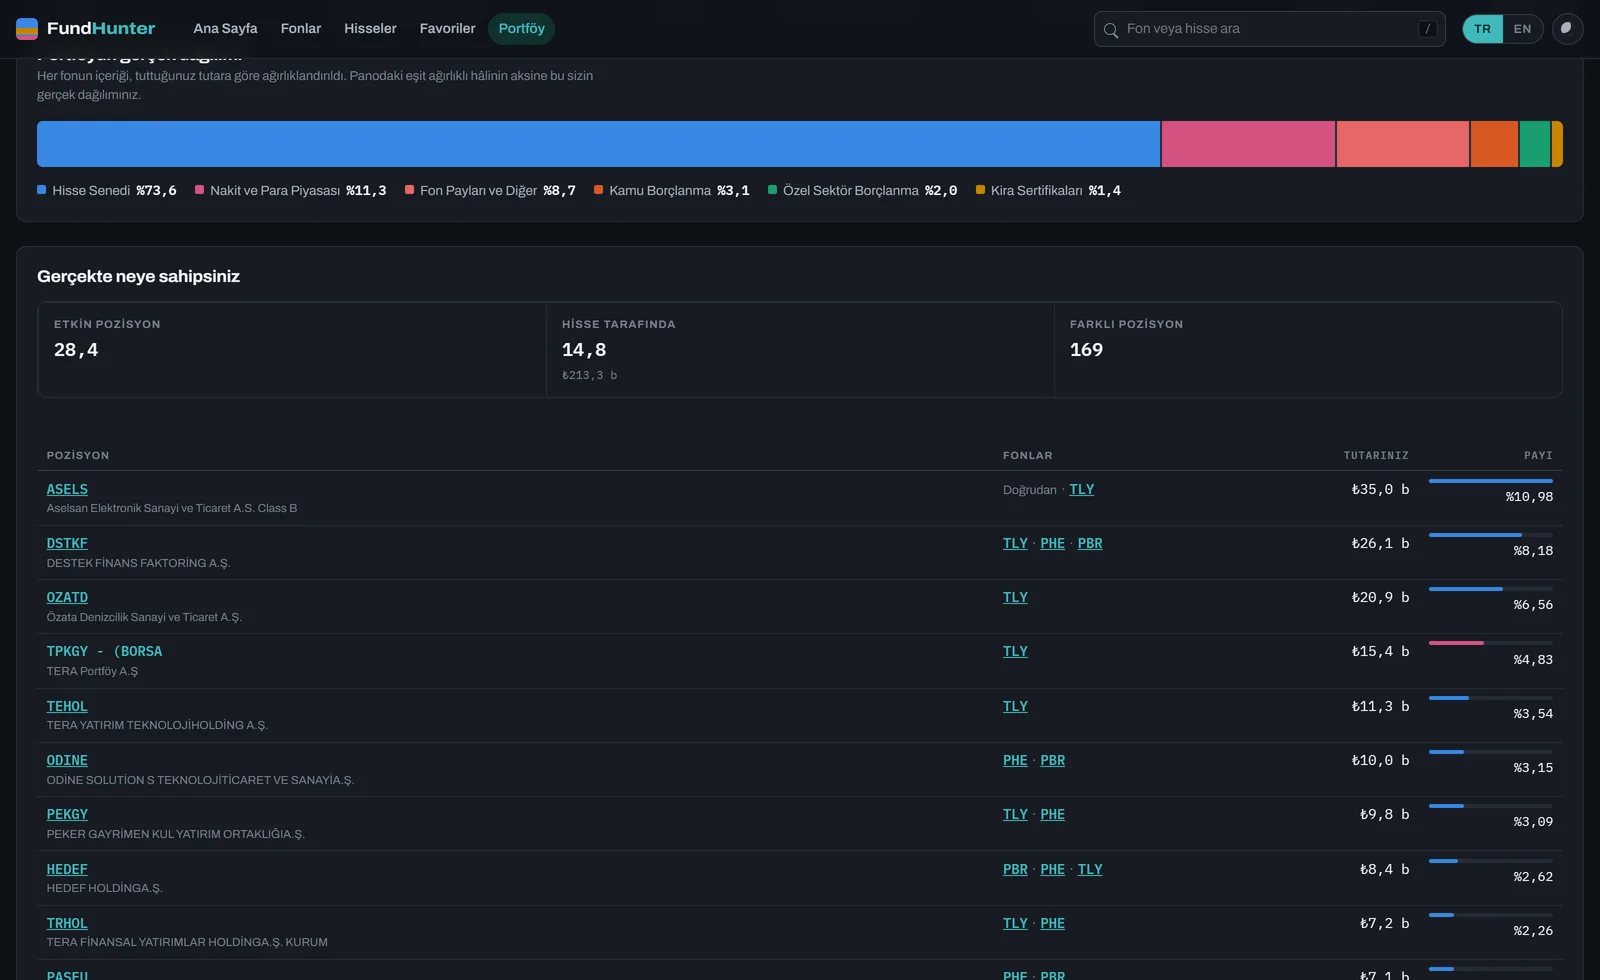
Three things are counted rather than assumed away, because each would otherwise turn a partial answer into a confident one:
- Coverage — a fund with no filing is still money you hold and still counts toward the total, but the percentages are shares of what could actually be seen into, and the difference is printed in lira
- Funds inside funds are followed through a second filing with a cycle guard, because “you own 42% of another fund” answers nothing
- A holding with no code is a stated residual, never pooled by name
Concentration is published as a count, not an index: the number of equal-sized positions your money is really spread over.
Portfolio overlap
The panel no fund page can ever draw, because it needs every fund’s filing at once. Two funds sharing most of their portfolio are one position wearing two names, and someone holding both believes they have diversified.
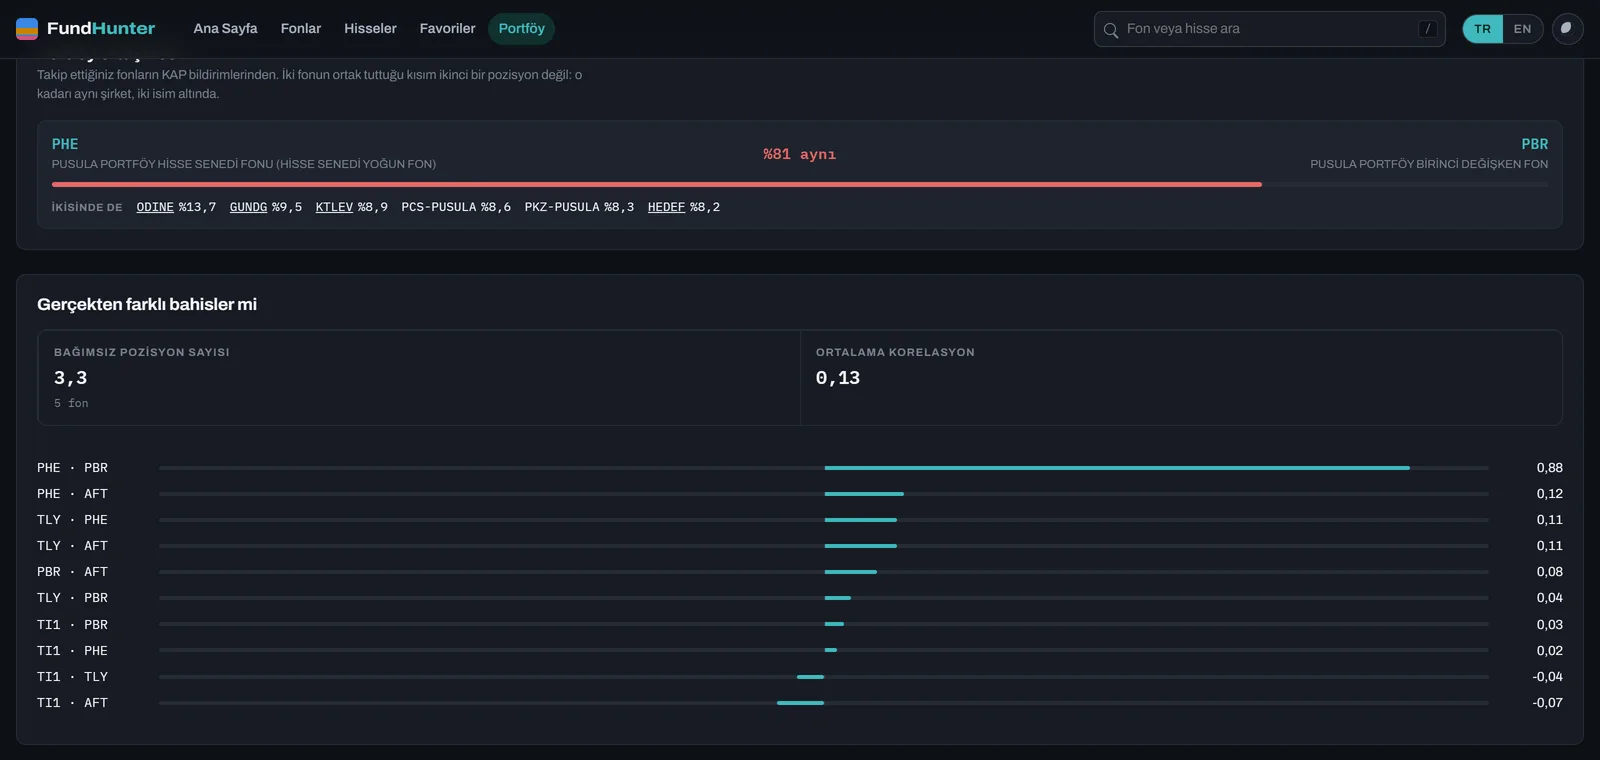
The measure is the sum of the smaller weight wherever both hold the same thing — two funds each 40% in a share overlap 40 points there; one at 40% and one at 5% overlap 5. That is the amount of the pair which is not a second position at all, and it runs 0 to 100 the way a reader expects. Not correlation, which two funds holding entirely different banks would score high on and which says nothing about owning the same shares twice.
The median pair overlaps nothing at all, so on most watchlists this draws one line saying the funds do not repeat each other — which is itself worth reading once.
A second panel answers the other half, and they are genuinely different questions. Two funds can share no position at all and still be one bet: a Turkish equity fund and a Turkish equity fund are both a bet on Turkish equity whichever companies they picked. Correlating their daily returns — on the days both actually printed, never on a carried-forward price — gives the number that can be acted on.
Quality scoring
Only 349 of 1,991 funds (17.5%) beat cash over the past year, after tax. The median equity fund returned 28.2% and the median bond fund 23.6%, against 47.8% for money-market funds. Any ranking that does not put that hurdle front and centre would be flattering nonsense, so the money market is the benchmark everything is measured against.
Funds are ranked on after-tax excess return over cash, per unit of volatility — one defensible number rather than a blended score with invented weights. Everything else is an explicit flag you can read and disagree with.
Two rules keep the comparison honest, and both started as bugs:
- The hurdle matches the horizon. Subtracting an annual cash figure from a three-month fund return is a 37-point error on every row, so
cashReturnForreturns null rather than substitute the wrong window, and the ranking blanks instead of lying - The gap is in percentage points, not per cent. A fund on 52% against a benchmark on 48% did not beat it “by 4%” — a test asserts the output never contains a percent sign
Peers are derived from what a fund actually holds, not TEFAS’s umbrella category, which files a gold fund and a leveraged equity fund under the same label.
Leverage
82 of 2,062 funds hold more than they own, 14 of them past 2× and the largest at 10.6×.
It reads off TEFAS’s own composition. Asset-class weights are published against net asset value and sum to 100, so a fund that borrows reports the borrowing as a negative class — almost always cash, where repo sits — and its positive classes then add up to more than 100. Summing the positive side is the gross exposure.
The threshold is 1.05×, not 1.0: weights are published to two decimals and a fund can round its way past 100% without having borrowed anything. Derivative leverage is not in the figure, and the tooltip says so.
Withholding and fees
Turkish fund gains carry two rates and nothing between them: 17.5%, or nothing at all. Nothing is inferred about which applies. A hisse senedi yoğun fon is a designation the fund holds, and TEFAS states it in the fund’s official title — 459 of 2,067 funds carry it, and gains on one are exempt outright, with no holding period.
Two earlier attempts were wrong, and instructively so — both tried to re-derive a legal status from data that only describes a portfolio:
- Requiring the gain to be held a year. That is a different exemption entirely
- Deriving the designation from composition. Wrong twice over: 286 of the 459 designated funds sit under the Serbest umbrella, so a category test drops them; and funds park cash before redemptions, so a weekly allocation snapshot dips below any threshold you pick. It is a noisy observation of a portfolio, not a licence
Beside it, in lira: what the management fees have already taken. Not a bill — a Turkish fund’s expense ratio comes out inside the unit price, so the money has gone — but 2.56% on a fund page reads as nothing and ₺433 against a real holding does not.
How often, not how much
A trailing return is one window chosen by the calendar, and it is the easiest number on a fund page to be fooled by: eleven months behind the money market and one enormous fortnight prints the same figure as a fund that was ahead the whole way.
So every fund page also asks the question at every start date. AFA finished ahead of cash in 4 of 28 six-month windows — with a positive trailing return. Windows overlap, so nothing is dressed up as a significance test; the denominator is printed beside every percentage.
Prediction
TEFAS publishes a fund’s NAV one business day after the market it reflects — so on any given day the benchmark closes are already known and the fund’s price is not. That gap is the prediction, and it needs no live data.
Each fund’s daily returns are regressed (ridge) on BIST 100, gram gold, USD/TRY and the cash index; the betas, R² and residual σ are stored at build time, and the browser applies them to the moves the fund has not yet priced in. Estimates are withheld below R² 0.5 and the explainability figure is always shown — a BIST-30 index fund fits at R² 0.967 with beta 1.05; a hedge fund fits at 0.08 and gets no estimate rather than a confident-looking guess.
How It Works
High-level runtime flow
- GitHub Actions runs three jobs on three cadences, each committing JSON to the repository.
fetch-tefas.mjspulls the fund universe, allocations and price history from TEFAS’s undocumented JSON API, caching every response by the date range it covers.fetch-holdings.mjsfinds the month’s Portföy Dağılım Raporu filings on KAP, downloads the PDFs, and extracts each fund’s individual positions.fetch-stocks.mjs,fetch-sectors.mjs,fetch-benchmarks.mjsandfetch-crashes.mjsadd the share index, industry classification, comparison series, and what every fund did through each of BIST’s falls.build-analytics.mjsruns last, enrichingfunds.jsonwith flows, factor models, peer groups, crash protection, themes and dividends.- The browser fetches
meta.jsonandfunds.jsonon first load and everything else lazily —stocks.jsononly when a share page is opened, a fund’s holdings only on its own page. - Live quotes come from two independent feeds at runtime, and the page is no worse off when either fails.
Sequence diagram — opening a fund page
Flow diagram — three jobs, three cadences
concurrency 2, adaptive backoff"] C --> D["28-day chunks, anchored to a fixed epoch"] D --> E["funds.json + history/CODE.jsonl"] A --> F["fetch-benchmarks.mjs + fetch-stocks.mjs"] F --> G["benchmarks.jsonl + stocks.json"] H["holdings.yml — daily 10:00 UTC"] --> I{"Could this fund
have a new filing?"} I -->|"already hold it"| J["skip"] I -->|"filed < 28 days ago"| J I -->|"never seen"| K["KAP JSON tier
byCriteria, day by day"] K --> L["Download PDF
(Java-serialised byte[])"] L --> M["lib/pdf.mjs — Flate, Type0 fonts,
ToUnicode CMap, graphics matrix"] M --> N["lib/portfolio.mjs — two templates,
FPD column, per-document numeric convention"] N --> O{"Do the group
subtotals reconcile?"} O -->|"no"| P["Skip the fund — never published"] O -->|"yes"| Q["holdings/CODE.json"] R["crashes.yml — Sundays"] --> S["crashEpisodes over 3y of BIST"] S --> T["NAV at both ends of each fall"] T --> U["crashes.json"] E --> V["build-analytics.mjs"] G --> V Q --> V U --> V V --> W["git commit && git push
(one concurrency group)"] style A fill:#1a3a5c,stroke:#4a90d9,color:#fff style H fill:#1a3a5c,stroke:#4a90d9,color:#fff style R fill:#1a3a5c,stroke:#4a90d9,color:#fff style P fill:#7f1d1d,stroke:#f87171,color:#fff style V fill:#166534,stroke:#4ade80,color:#fff style W fill:#166534,stroke:#4ade80,color:#fff
Architecture
Deliberately the same shape as Çanakkale Hat & Sefer: plain ES modules, no bundler, GitHub Pages.
| Component | Where it runs | Purpose |
|---|---|---|
index.html |
Browser | Shell — masthead, market tape, mount point |
core.js |
Browser / Node | Headless logic: i18n, formatting, filter/sort, composition maths, return and risk metrics, HORIZONS. No DOM — imported by the browser, the build scripts and the tests, so a “1-year return” has exactly one definition |
analytics.js |
Browser / Node | Tax model, peer groups, risk bands, fund flows, factor models, ranking. Same three consumers |
ui.js |
Browser | Routing, rendering, inline-SVG charts |
quotes.js |
Browser | Runtime quotes for every BIST share and the US names funds hold, plus the arithmetic that turns them into a fund’s estimated move |
live.js |
Browser | Runtime quotes for the market tape (index, FX, gold), with a fall back to committed closes |
sw.js |
Browser (Service Worker) | Document network-first, everything else same-origin cache-while-revalidate; the two market feeds never touched |
scripts/*.mjs |
GitHub Actions (Node.js) | The five fetch stages and the analytics pass |
scripts/lib/pdf.mjs |
GitHub Actions | PDF text extractor — positioned runs, no dependency |
scripts/lib/portfolio.mjs |
GitHub Actions | Reads a filing into holdings, and reconciles it |
quotes.js is kept separate from live.js on purpose: different source, different failure mode — one being blocked must not take the other down.
Why the daily job is minutes and not most of an hour
Every response is cached by the date range it covers, and a past range never changes. The year of history is fetched in fixed windows, so of 106 allocation requests exactly one is new on any given day.
None of which helped, because .cache/ is git-ignored and nothing restored it between runs. Every night the runner started cold and re-fetched a year to learn one day: 32 minutes for TEFAS and 8 more for the falls. An actions/cache step is the whole fix. KAP’s PDFs are excluded from it — they are 1.3GB, and the holdings job is built not to want them.
A related trap: chunk boundaries are anchored to a fixed epoch, not to the requested range. Anchoring to “today” gave every chunk a new cache key when the trading date rolled over, so the cron re-fetched all ~200 requests daily instead of one.
Reading the KAP filings
KAP’s pages are behind bot protection — a headless browser renders about 1.4KB of chrome and nothing else. Its JSON tier is not, which is the same split TEFAS has. Four things about that API are not obvious:
- The disclosure query caps at 2000 rows and its
pagefield does nothing — the only way past the cap is to narrow the dates, so the filing window is walked day by day - Sending the filter fields KAP’s own UI sends makes the endpoint answer HTTP 500; a bare date range works, so subject filtering happens client-side
- The file endpoint returns a Java-serialised
byte[], not a file — the 0xACED stream magic comes first and%PDFstarts a few bytes in attachmentCountis in the listing, so filings with no PDF are skipped without spending a request
lib/pdf.mjs is a small PDF text extractor written from scratch — a library would have been the obvious move, but this project has no dependencies by design and the reports use a narrow slice of the format. Four bugs in it each produced nothing rather than something visibly wrong, so all four are regression-tested:
- Pages were pooled into one coordinate space, so rows that merely shared a y on different sheets merged
- Page order came from object numbering, which is not page order — an ETF files a month of daily reports as one 114-page PDF
- Streams were assumed to be Flate — several filers store their ToUnicode CMaps uncompressed
- The graphics matrix was ignored. A whole class of filers draws the page through a vertical flip (
cm 0.75 0 0 -0.75 0 841.92). Honouring the matrix took that group from 0 to 100% parsed
Trusting the result
The regulator fixes the contents of a filing but not the typesetting, so filers use two templates and both are supported. Numbers arrive as 1.234,56 or 1,234.56 depending on the filer, so the convention is detected per document — reading one as the other is silent and off by a factor of a thousand.
The weight has to come from the FPD column, not from the value. A report prints three percentages per row: share of its group, share of the fund’s portfolio value (FPD), and share of its total value (FTD). Only FPD is a portfolio weight, and the difference is not cosmetic — a futures position carries a market value but an FPD of zero. One sampled fund holds 8.8bn of futures notional against a 43bn portfolio; deriving weights from value would have shown it owning a fifth more than it does.
Every group prints a subtotal directly beneath the rows that make it up, so a parse that read the wrong column, dropped a row or double-counted one cannot add up. That check separates two failures that look identical from outside:
- The parse is wrong — subtotals do not reproduce. The fund is skipped, never published
- The report is wrong — every subtotal reconciles but the overall total does not. One filer states a weight computed against a position’s dollar nominal rather than its lira value, so its own percentages sum to 94.94%. Throwing that fund away over someone else’s arithmetic would be the wrong call, so it publishes with the discrepancy recorded and shown on the page
One trap worth writing down, because it is invisible until it bites: JavaScript’s i flag does not fold Turkish dotted İ onto i. A pattern ending in a literal i matched the mixed-case reports and silently missed every upper-case one, which cost the net asset value across a whole template.
Two ways the price data lies
- Unit-price restatements. A fund occasionally multiplies its unit price by some factor and divides the units by the same one, leaving holders with exactly what they had. TEFAS publishes the new price with no marker, so the two prices either side read as a return of +8,229% — ₺1.20 to ₺116.87 overnight. The units outstanding give it away: a return does not move them, flows do not move them opposite to the price, and only a restatement moves both by a large factor in opposite directions. Seven found and dropped
- Funds too small to have a price. Under about ₺5m a unit price is not a market price — one subscription moves it. One fund held ₺3.3m, reported its units as 9.5m, 1.5m, 3.3m and 265k on four consecutive days, and came out of that window with a “return” of +672%. Every remaining figure above +200% in three years of falls was one of these; the floor costs 436 of 16,839 measurements and none survive it
Data model
History is cumulative and append-only. The fetch window slides forward, but nothing already on disk is dropped, and files are newline-delimited and sorted by date — so a daily run appends a line or two per fund and the git delta stays proportional to what changed rather than to the file size.
data/history/AAK.jsonl:
{"d":"2026-08-13","p":3.4589,"iv":4468,"sz":2111110055.37}
{"d":"2026-08-14","p":3.4617,"iv":4468,"sz":2113904811.02,"a":{"hs":79.76,"tr":13.08}}
p price · iv investors · sz portfolio size · a allocation (weekly snapshots only, raw TEFAS field codes). Shares outstanding is deliberately not stored — it is exactly sz / p.
| File | What it holds | Fetched |
|---|---|---|
meta.json |
taxonomy, categories, managers, colours, peer stats | always |
funds.json |
one line per fund — the list/search index | always |
history/<CODE>.jsonl |
per-fund daily prices + weekly allocation | per fund |
holdings/<CODE>.json |
individual positions from the monthly KAP filing | per fund |
benchmarks.jsonl |
BIST 100/30, USD, EUR, gold, money market — five years | on a chart |
crashes.json |
BIST’s falls, and what every fund did over each | on demand |
stocks.json |
648 listings: figures, balance sheet, targets, holders | share pages only |
stocks/<CODE>.fin.json |
the company’s own statements — 32 quarters, 20 years | one company |
cpi.json |
Turkish CPI by year, from the World Bank — 2KB | real terms only |
Asset-class colours
The eight asset groups use a CVD-validated categorical palette in a fixed order. Eight is a hard cap, not a coincidence — it is how many hues stay distinguishable under colour-vision deficiency. Adjacent-pair separation is ΔE 9.1 (light) and 8.4 (dark) against the site’s surfaces.
Two related rules the UI holds to: the teal accent exists precisely because red and green are reserved for gains and losses, and every return value pairs its colour with an arrow glyph so colour is never the only carrier of meaning.
Tech
| Layer | Library / Service |
|---|---|
| Fund data | TEFAS (Takasbank) — undocumented public JSON API |
| Holdings | KAP Portföy Dağılım Raporu filings, parsed from PDF |
| Benchmarks | Yahoo Finance — XU100.IS, XU030.IS, USDTRY=X, EURTRY=X, GC=F |
| Tape quotes | Truncgil — the one host that serves these instruments and sends Access-Control-Allow-Origin: * |
| Share quotes | TradingView scanner, delayed 15 minutes |
| Consumer prices | World Bank |
| Charts | Inline SVG, hand-written — no charting library |
| Offline | Service worker — document network-first, same-origin cache-while-revalidate |
| Tests | node:test, 342 tests over core.js, analytics.js, the PDF and portfolio parsers |
| CI/CD | GitHub Actions — three crons, commits JSON to the repo |
| Hosting | GitHub Pages |
| Runtime dependencies | None — no frameworks, no bundler, no build step |
Running it
npm test              # 342 tests, no dependencies
npm run build:data    # all five stages in order
npm run serve         # http://localhost:8080
The five data stages must run in order — the falls need the benchmarks, the sectors need the holdings, and analytics needs all of them. A cold fetch-tefas takes ~30 minutes; with .cache/ warm it is seconds. scripts/fetch-tefas.mjs --quick fetches one month instead of twelve, which is what you want when working on the UI.
Holdings are refreshed separately, once a month rather than daily, because that is how often the source is published:
npm run fetch:holdings                                     # last month, every fund
node scripts/fetch-holdings.mjs --month 2026-07 --report   # coverage, writes nothing
node scripts/fetch-holdings.mjs --codes TLY,HVZ            # a couple of funds
The first pass downloads about a thousand PDFs per month and KAP throttles hard — measured at roughly 200 an hour — so expect hours, not minutes. Downloads are cached, so a re-run only fetches what is new, and each fund is written the moment both of its months are read: an interrupted run leaves a consistent partial state rather than nothing. Funds are processed largest first, so the pages most people open have their comparison within the first few minutes rather than the last.
Coverage, which is the real limit
Individual holdings cover 881 funds of 2,063, and that is the ceiling on the look-through, the themes, the dividend figures and the overlap panels alike — every one of them gets better the same way, by reading more filings.
| Measure | Coverage |
|---|---|
| Funds in the universe | 2,063 (plus 648 Borsa İstanbul listings) |
| Crash protection | 2,008 funds — 99.7% of the industry’s money |
| Readable KAP filing | 881 funds |
| Theme breakdown | 438 funds |
| Dividend figure | 508 funds |
| 3-year / 5-year returns | 1,187 / 622 funds (TEFAS reports null for the rest) |
Where a figure does not exist, the page shows nothing and sorts last rather than at zero — a null is the honest signal that a fund was not there for the window, and scoreFund returns null rather than invent an excess.
Data & disclaimer
Fund data from TEFAS (Takasbank). Benchmark history from Yahoo Finance. Consumer prices from the World Bank. Tape quotes from Truncgil; share prices from TradingView, delayed 15 minutes as Borsa İstanbul’s real-time feed is licensed. This is an independent project with no affiliation to any of them.
Not investment advice. Past performance does not guarantee future results.
The source is MIT. That covers the code, not the contents of data/, which is fetched from the sources above and republished unchanged — each remains subject to its own source’s terms.